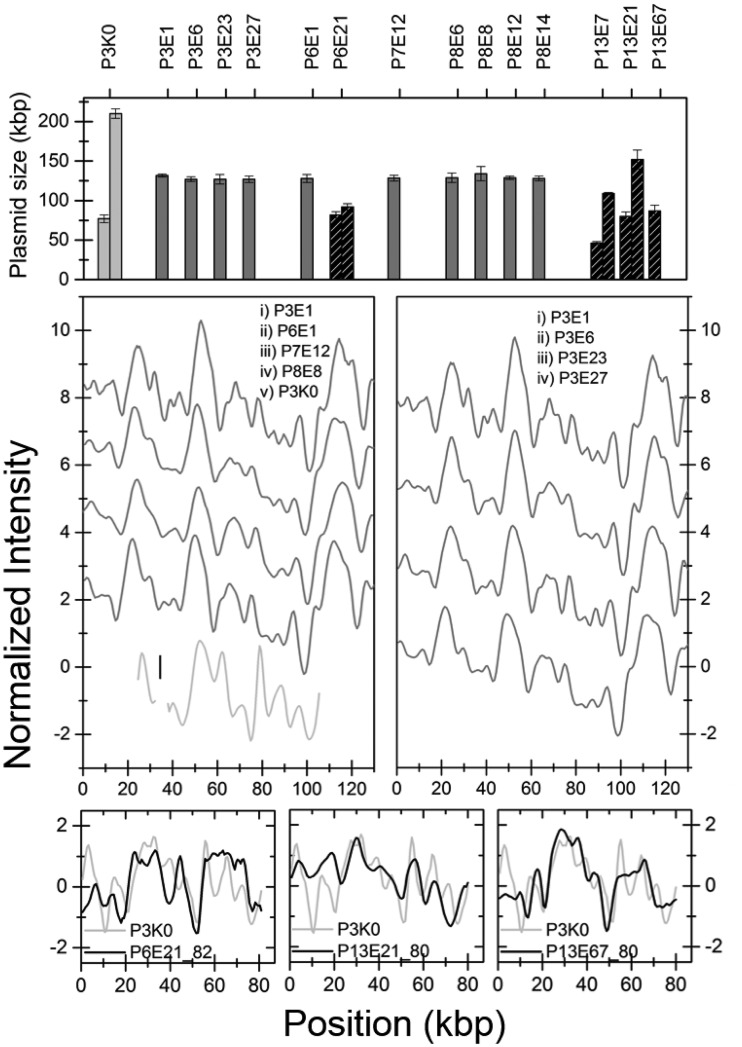
FIG 5.
(A) Histogram of sizes of plasmids in all E. coli isolates investigated. The dark gray bars represent isolates carrying the same plasmid, studied in detail in panels B and C. The black hatched bars are isolates with unique plasmid content, and some of these are shown in panels D to F. The light gray columns are from the reference ESBL-KP isolate P3K0. (B) Barcodes of the 129-kbp plasmid in the E. coli isolates with a common plasmid size from different patients (dark gray). The plasmid carrying the blaCTX-M-15 gene in P3K0 is also shown for comparison (light gray). (C) The 129-kbp plasmid in patient 3 at different time points. The lines are shifted vertically for clarity. (D to F) Comparisons between the 80-kbp plasmid carrying the blaCTX-M-15 gene in P3K0 (light gray) and plasmids of similar size in the ESBL-EC isolates (black).

