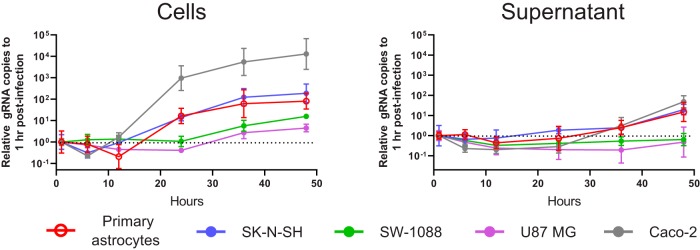
FIG 3.
Single-step growth curve of VA1 (MOI of 3) in primary astrocytes and immortalized cell lines, including SK-N-SH, SW-1088, U87 MG, and Caco-2 cells. Data points are normalized to the gRNA copy number that was present 1 h after inoculation for each cell line. Geometric means with error bars representing 1 geometric standard deviation are plotted. The horizontal dotted line represents the relative gRNA copy number at 1 h postinoculation.

