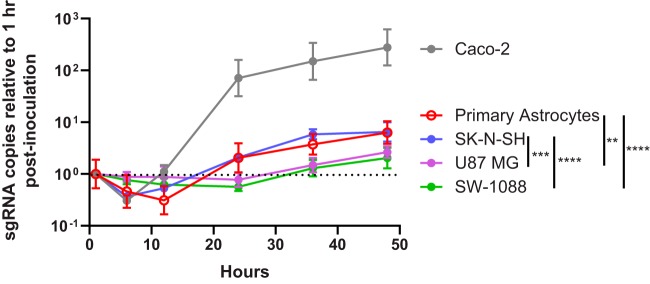
FIG 5.
Quantification of sgRNA in single-step growth curves of VA1 (MOI of 3) from the cellular fraction of each cell line. Each plotted data point represents the geometric mean normalized to the copy number present at 1 h postinoculation with error bars representing 1 geometric standard deviation. The dotted horizontal line represents relative sgRNA present at 1 h postinoculation. The maximum P value for each cell line comparison at 24, 36, or 48 h postinoculation is depicted. **, P ≤ 0.01; ***, P ≤ 0.001; ****, P ≤ 0.0001.

