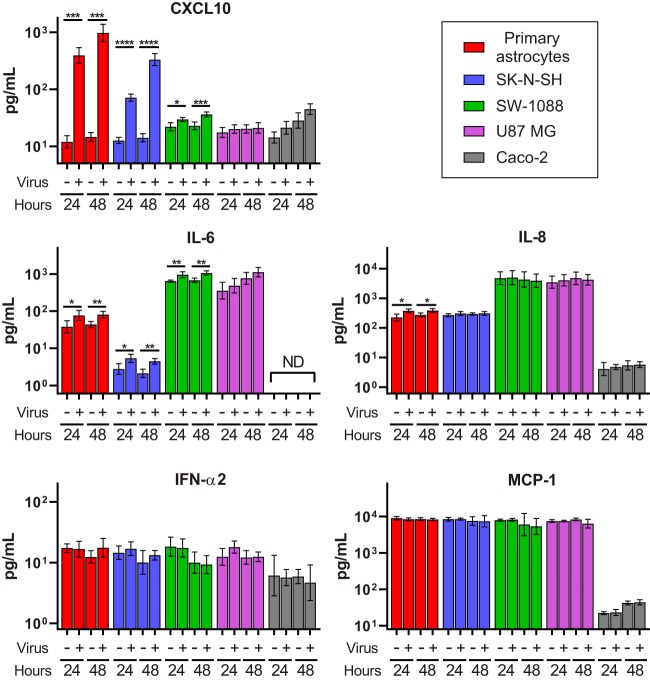
FIG 6.
Cytokine expression in mock-infected or infected cell lines at 24 h and 48 h postinoculation. Geometric mean cytokine concentrations are plotted in picograms per milliliter with error bars representing 1 geometric standard deviation. *, P ≤ 0.05; **, P ≤ 0.01; ***, P ≤ 0.001; ****, P ≤ 0.0001.

