Fig. 1.

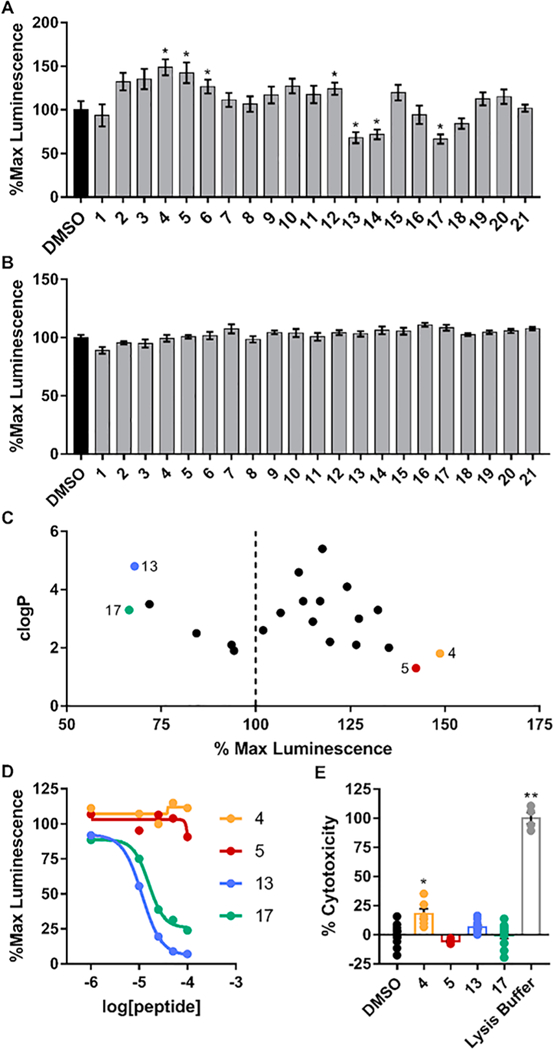
LCA screening of peptidomimetics. A, B) Bar graphs of % maximal luminescence values derived from HEK293 cells stably expressing CLuc-FGF14 and CD4-Nav1.6-NLuc constructs using LCA (A) or transiently transfected with the full-length photinus luciferase (B) treated with either vehicle (0.5% DMSO) or compounds (final concentration=50 μM). C) Comparison of peptidomimetic clogP values and % max luminescence responses. The top two inhibitors and enhancers (Compounds 4, 5, 13, and 17) were selected for further evaluation. D) LCA-based dose-response of compounds 4, 5, 13 and 17 in cells stably expressing CLuc-FGF14 and CD4-Nav1.6-NLuc. E) Bar graph of % cytotoxicity as measured using the LDH cytotoxicity assay of selected compounds at the concentration of 50 μM. Data are mean ± S.E.M. *, p < 0.05; **, p < 0.001.
