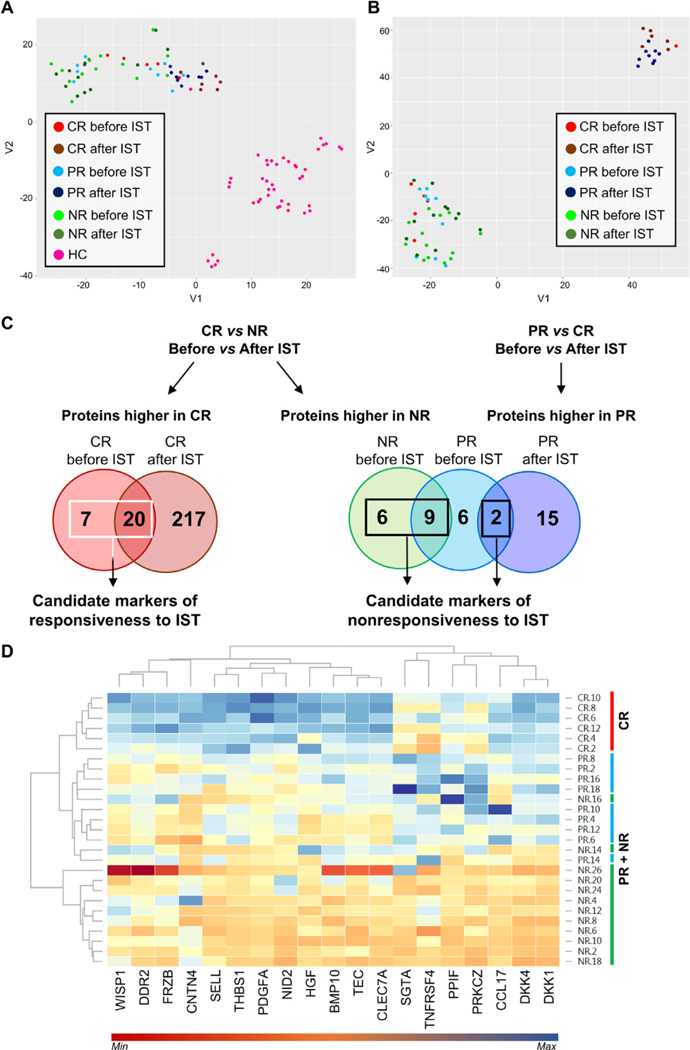
Figure 1.

SOMAscan data analysis of serum samples from AA patients. t-SNE testing was carried out on AA patients at diagnosis and after IST and on healthy controls (HC) (A), also including blood counts (B). Patients were divided according to clinical response at 6 months or 1 year after treatment as CR, PR, or NR. (C) In order to find protein markers of responsiveness to therapy, unpaired t test was performed between CR and NR or PR before and after IST and proteins were grouped using Venn diagrams. Proteins higher in CR at diagnosis and after IST (n = 27) were chosen as candidate biomarkers of responsiveness to therapy, whereas proteins higher in NR and PR at baseline and after treatment (n =16) were selected as candidate biomarkers of nonresponsiveness to IST. (D) Protein levels after treatment of selected 19 candidate biomarkers are shown as a heat map with hierarchical clustering using a web-based tool. CR patients were grouped together and not mixed with PR or NR.
