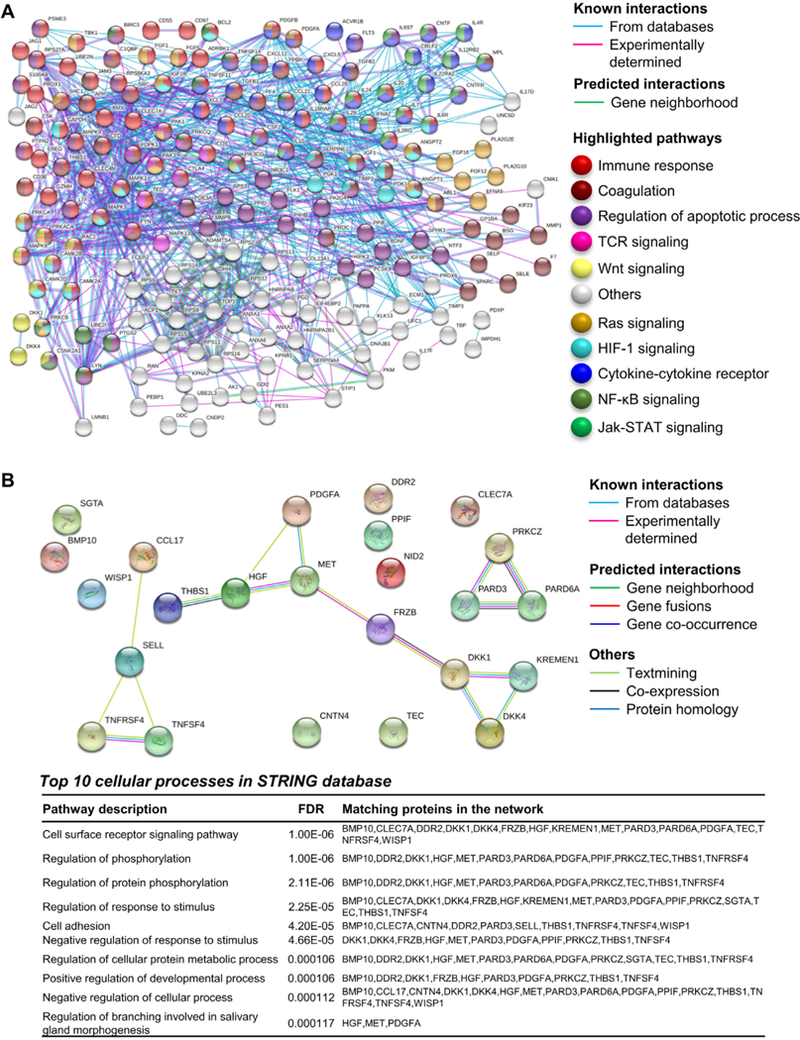
Figure 2.

Protein pathway analysis using serum proteins present in healthy controls and/or AA patients. (A) STRING database was employed for protein pathway analysis using proteins higher in HC compared by unpaired t test with AA patients before IST. Known (from databases or experimentally determined) or predicted (based on gene neighborhood) interactions are shown. Proteins related to immune response, coagulation, regulation of apoptotic process, cytokine-cytokine receptor interaction, T-cell receptor (TCR), and Wnt, Ras, HIF-1, NF-κB and Jak-STAT signaling cascades are highlighted with different colors accordingly. (B) STRING database was employed for protein pathway analysis using the 19 selected serum candidate markers and the top 10 cellular processes are shown.
