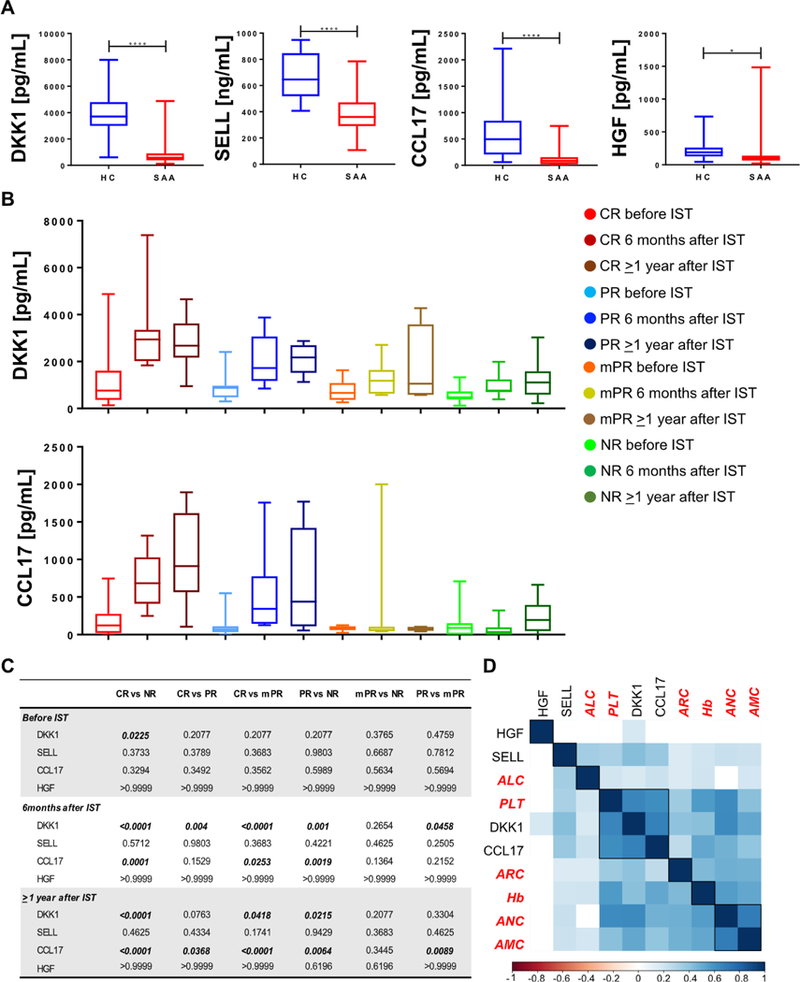
Figure 3.

Diagnostic power of selected protein markers in the verification cohort. (A) Protein levels were compared between patients and a group of age- and sex-matched healthy controls (HC) by unpaired t test. Values are shown as minimum to maximum. (B) Protein levels were measured by Luminex and data for DKK1 and CCL17 are shown as minimum to maximum for each group of patients. (C) Protein levels were compared among groups and time points by one-way ANOVA. Values with p < 0.05 are bolded. (D) Correlation analysis between protein markers and blood counts was performed by Pearson analysis.
