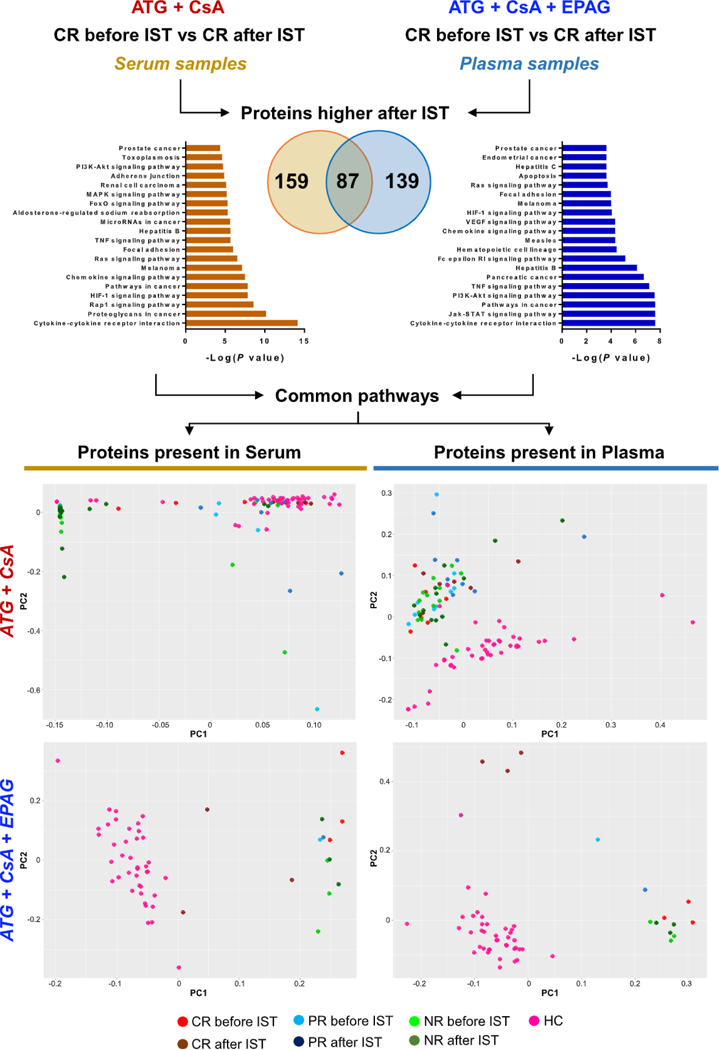
Figure 5.

Plasma and serum proteomic signatures in patients after different ISTs. Unpaired t test was performed between CR before and after therapy using two SOMAscan datasets obtained from serum samples in patients treated with standard IST (anti-thymocyte globulin [ATGJ and cyclosporine A [CsA]) or from plasma samples in patients treated with standard IST and EPAG. Proteins higher in CR after therapy were grouped and interpolated using Venn diagrams. Using proteins present only in serum (159) or plasma (139), protein pathway analysis was performed and the top 20 pathways are shown (left and right for serum and plasma proteins, respectively). Multiple common pathways were identified and proteins from serum and plasma signatures were grouped. Using these two groups of proteins, PCA was performed in patients treated with standard IST (upper row) and in those who received standard IST and EPAG (bottom row). Patients were divided according to hematologic responses to therapy in CR, PR, and NR. HC ==healthy controls.
