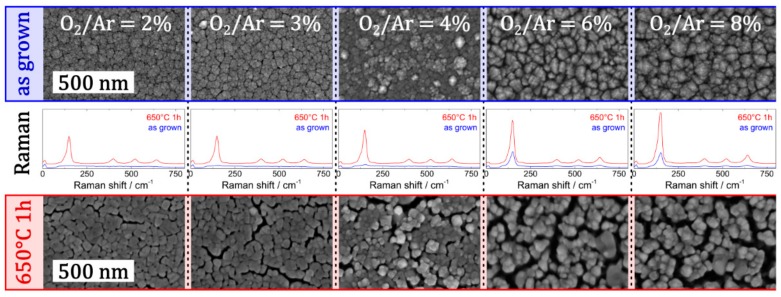
Figure 7.
Impact of a variation of O2/Ar flow ratio on the morphology and crystallinity of a TiO2 thin film deposited by sputter deposition: Top view SEM micrographs (having same scale bar of 500 nm) of the as-grown thin film (upper row) and the thin film with nanocrack networks after heat treatment at 650 °C for 1 h (bottom row). The corresponding Raman spectra are depicted in the middle row. Adapted with permission from [24]. Copyright (2019) IOP.

