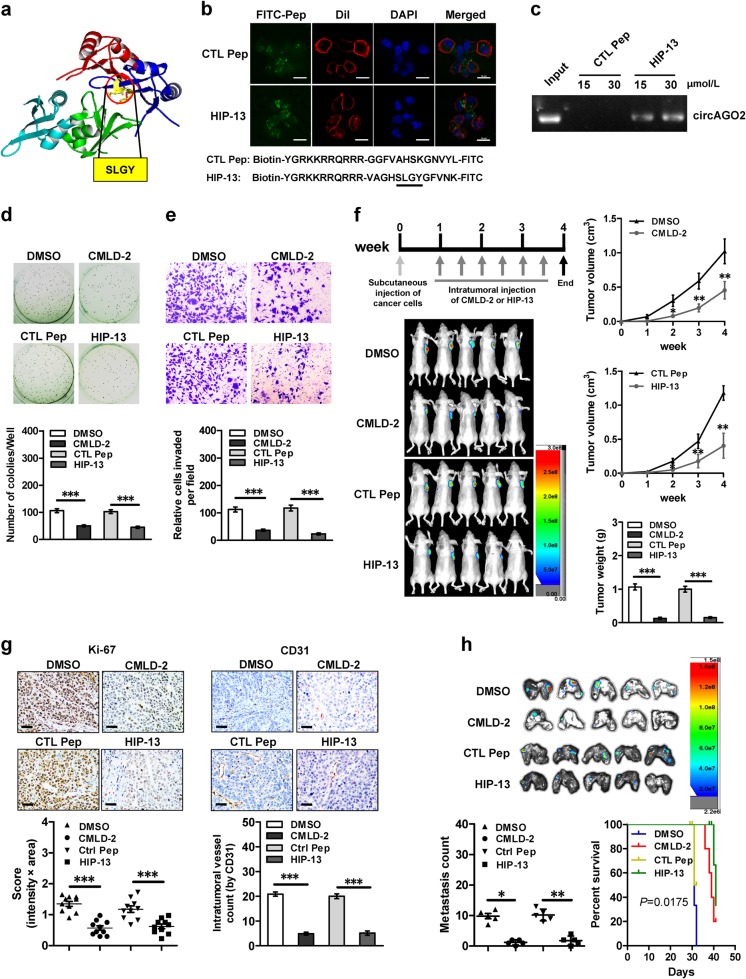
Fig. 6.
Inhibitory peptides suppress cancer progression by blocking the circAGO2-HuR interaction. a Schematic illustration showing the structure and core amino acids (SLGY) of HuR protein essential for interacting with circAGO2. b Confocal images (upper panel) revealing the distribution of synthesized control peptide (CTL Pep) or inhibitory peptide (HIP-13, lower panel) after incubation with AGS cells for 48 h. The nuclei were stained with DAPI (blue), while cellular membrane was stained with Dil (red). Scale bar: 10 μm. c Biotin-labeled peptide pull-down assay indicating the interaction of CTL Pep (30 μmol·L−1) or HIP-13 (15 and 30 μmol·L−1) with circAGO2 of AGS cells. d, e Representative images (upper panel) and quantification (lower panel) of soft agar (d) and matrigel invasion (e) assays showing the anchorage-independent growth and invasion of AGS cells treated with solvent control (DMSO), CMLD-2 (30 μmol·L−1), CTL Pep (30 μmol·L−1), or HIP-13 (30 μmol·L−1) for 48 h. f, g Representative images (f, left lower panel), in vivo growth curve (f, right upper panel), tumor weight at the end points (f, right lower panel), intratumoral expression of Ki-67 and CD31 (g) of xenografts formed by subcutaneous injection of AGS cells into nude mice (n = 5 for each group) that subsequently treated with intratumoral injection of DMSO, CMLD-2 (3 mg·kg−1), CTL Pep (3 mg·kg−1), or HIP-13 (3 mg·kg−1) as indicated (f, left upper panel). Scale bar: 50 μm. h Representative images (upper panel) and quantification (lower left panel) of lung metastatic colonization, and survival curves (lower right panel) of nude mice (n = 5 for each group) treated with tail vein injection of AGS cells and subsequent administration of DMSO, CMLD-2 (3 mg·kg−1), CTL Pep, or HIP-13 (3 mg·kg−1). Student’s t test and analysis of variance compared the difference in d–h. Log-rank test for survival comparison in h. *P < 0.05, **P < 0.01, ***P < 0.001 vs. DMSO or CTL Pep

