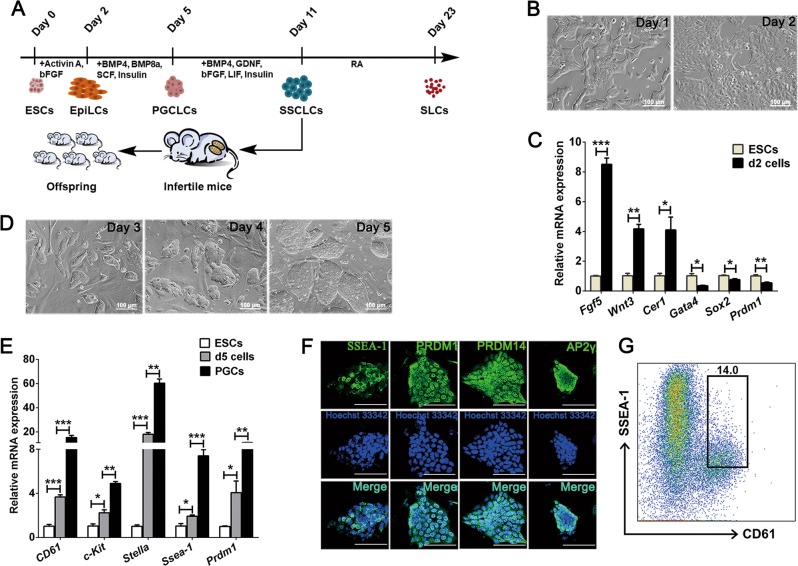
Fig. 1.
Generation of EpiLCs and PGCLCs from ESCs. a The male germline cell induction system and timeline. b Bright-field images of the day 1- and day 2-induced cells. Scale bar, 100 μm. c Real-time PCR analysis of Fgf5, Wnt3, Cer1, Gata4, Sox2, and Prdm1 expression levels in ESCs and the day 2-induced cells. d Bright-field images of the induced cells during day 3 to day 5. Scale bar, 100 μm. e Real-time PCR analysis of CD61, c-Kit, Stella, Ssea-1, and Prdm1 in ESCs, the day 5-induced cells and E12.5 PGCs. f Immunofluorescence staining of SSEA-1, PRDM1, PRDM14, and AP2γ in day 5-induced cells, counterstained with Hoechst 33342. Scale bar, 50 μm. g Flow cytometric analysis of CD61 and SSEA-1 expression of the day 5-induced cells. Data are represented as mean ± SEM from more than three independent experiments, *p < 0.05, **p < 0.01, ***p < 0.001

