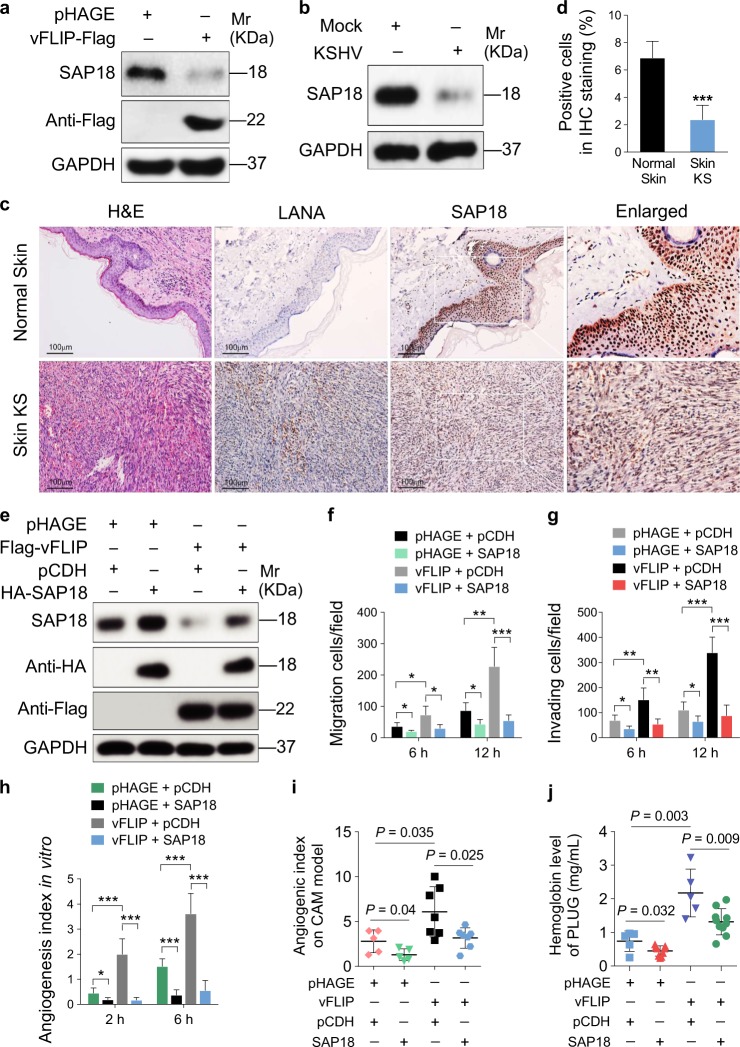
Fig. 2.
vFLIP downregulates SAP18 expression to promote cell motility and angiogenesis. a Western blotting analysis of SAP18 in HUVECs transduced with lentiviral vFLIP or its control pHAGE with the indicated antibodies. b Western blotting analysis of SAP18 in KSHV-infected or PBS-treated (Mock) HUVECs with the indicated antibodies. c Histologic features of KS lesion tissues (lower) and normal skin tissues (upper) were presented by hematoxylin and eosin (H&E) staining (×200), the expression levels of KSHV LANA and SAP18 in the tissues were examined by immunohistochemistry (IHC) assay (×200). d Results were quantified in (c) (***P < 0.001). e Western blotting analysis of SAP18 in lentiviral vFLIP- or control pHAGE-transduced HUVECs infected with lentiviral SAP18 (HA-SAP18) or its control pCDH (pCDH), respectively, with the indicated antibodies. f Cells treated as in (e) were subjected to transwell migration assay. Mean ± s.d. is adopted to quantify the results. Three independent experiments, each with quantic technical replicates, were performed. *P < 0.05, **P < 0.01, and ***P < 0.001. g Cells treated as in (e) were subjected to Matrigel invasion assay. Mean ± s.d. is adopted to quantify the results. Three independent experiments, each with quantic technical replicates, were performed. *P < 0.05, **P < 0.01, and ***P < 0.001. h Cells treated as in (e) were subjected to microtubule-formation assay. Mean ± s.d. is adopted to quantify the results. Three independent experiments, each with quantic technical replicates, were performed. *P < 0.05 and **P < 0.01. i Cells treated as in (e) were mixed with the high concentration Matrigel, and further inoculated onto CAMs to examine in vivo angiogenesis capability. The angiogenesis index on CAM model was quantified, and data are represented as mean ± s.d. Each group with at least five tumors. j The mixture containing high concentration Matrigel and cells treated as in (e) was injected into nude mice. The level of hemoglobin in plug tissues treated was measured by comparing the standard curve. Mean ± s.d. is adopted to quantify the results, with at least five tumors for each group

