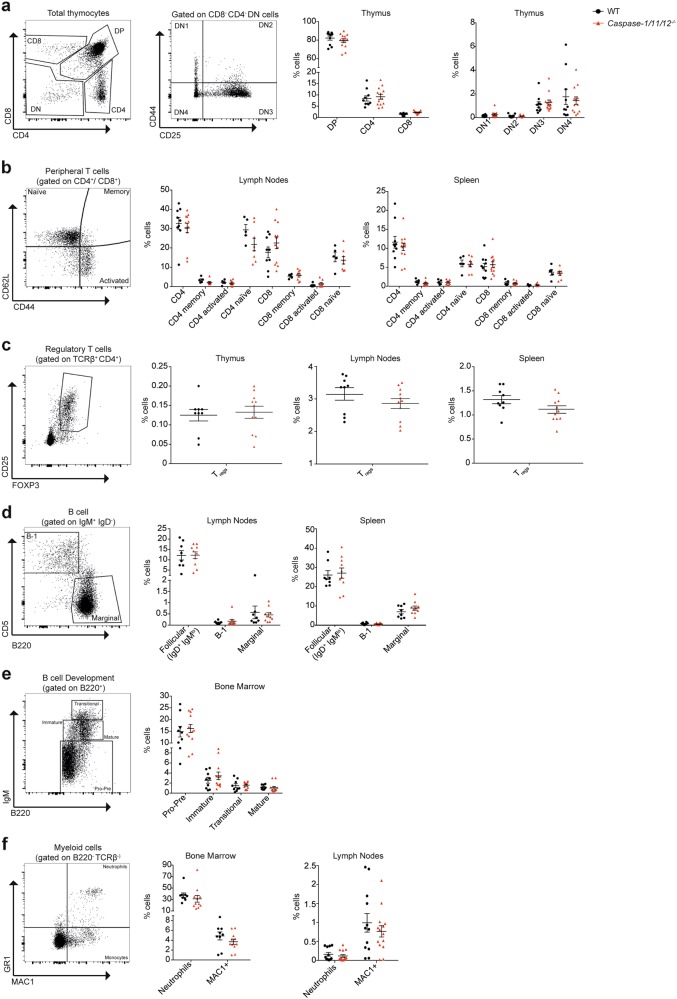
Fig. 2.
Normal haematopoietic cell subset composition in the bone marrow (both tibia and femur), lymph nodes (axial, brachial and inguinal), thymus and spleen of caspase-1/11/12 triple knockout mice. a (Left) Representative flow cytometry plots to examine T cell development in the thymus. Cell populations during development defined as CD8+, CD4+ and DP for CD4+CD8+ double-positive T cells. Additional analysis on double-negative (CD8−CD4−) progenitor cells, denoted DN, using antibodies against CD25 and CD44. Gating strategy on DN progenitor cells depicted in second flow cytometry plot from the left to further subdivide into DN1–4 stages as follows: DN1 (CD44+CD25−), DN2 (CD44+CD25+), DN3 (CD44−CD25+) and DN4 (CD44−CD25−). a (Right) Percentages for each of these T cell populations in the thymus of caspase-1/11/12 knockout and WT control mice. b (Left) Representative gating strategy for CD4+ T-cell activation. Naïve T cells that have not yet encountered an antigen do not express CD44 on the cell surface (top left quadrant). Upon activation by an antigen, T cells upregulate the CD44 expression (right panels). T cells with upregulated CD62L expression are considered memory T cells, whereas the so-called activated CD4+ T cells circulating in the periphery express low levels of CD62L. b (Right) Quantification of percentages of naïve, memory and activated CD4+ T cells in the spleen and lymph nodes from caspase-1/11/12 triple knockout and WT control mice. c (Left) Representative flow cytometry plots of T-cell populations in the lymphoid organs. Gating on regulatory T cells (Tregs) (CD4+CD25+FOXP3+). c (Right) Treg cell percentages in the thymus, lymph nodes and spleen. d (Left) Representative plots of B cell populations defined as B-1 (IgM+CD5+B220−) or marginal zone (IgM+B220+CD5−) B cells. d (Right) Percentages in lymph nodes and spleen are shown for each of these B-cell populations. e (Left) B-cell development using flow cytometric analysis. Representative plots showing pro-B/pre-B (B220+IgM−), immature B (B220+IgMlo), transitional B (B220+IgMhi) and mature B cells (B220hiIgMlo) in the bone marrow. e (Right) Quantitative analysis of these B cell populations. f (Left) Representation of myeloid cell populations analysed by flow cytometry. Top right represents neutrophils (GR-1+MAC-1+) and bottom right the monocyte population (GR-1−MAC-1+). f (Right) Percentages of these cells found in the bone marrow and lymph nodes. Graphs show means ± S.E.M. Cell numbers are presented in Supplementary Figure 2. n ≥ 5. Symbols represent individual mice. Results tested with two-way ANOVA or unpaired two-tailed Student's t test

