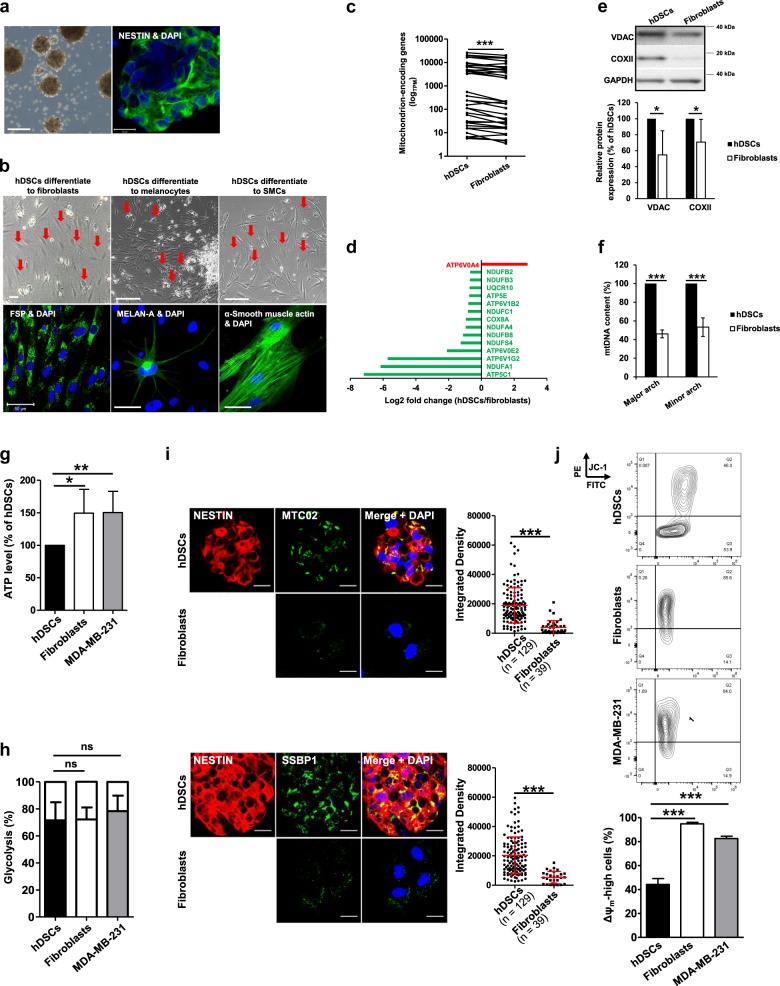
Fig. 1.
hDSCs have a higher mitochondrial content than the autologous fibroblasts; hDSCs, however, represent a heterogeneous population with cells exhibiting either low or high Δψm. a hDSCs are characterized by sphere formation and the expression of the neuronal progenitor marker NESTIN. Representative images show the hDSC spheres (scale bar: 100 μm) and NESTIN expression of hDSCs (scale bars: 20 μm). b hDSCs were able to differentiate to FSP positive fibroblasts, MELAN-A positive melanocytes, as well as smooth muscle actin-positive smooth muscle cells (SMCs). Scale bars: 50 µm. c RNA of hDSCs and the autologous fibroblasts of 3 different donors was assessed with transcriptome analysis by next generation sequencing using the low input RNA-seq protocol (Clontech SMARTer). Among differentially expressed genes, 37 mitochondrion-encoded genes were found to be highly expressed in hDSCs (padjusted < 0.05). TPM transcripts per kilobase million. The Wilcoxon signed rank test was performed for statistical analysis. Detailed information about these genes can be found in Supplementary Table S1. d Fifteen genes involved in the mitochondrial ETC were significantly expressed differentially (p adjusted < 0.05) and are presented as the log2 fold change with hDSCs as compared to fibroblasts. Color code: red and green indicate genes which are more highly or less expressed, respectively, in hDSCs. e Proteins were isolated from hDSCs and the autologous fibroblasts for Western blotting to investigate the expression of mitochondrially localizing proteins. A representative Western blot result is shown at the top. The expression levels of these proteins were quantified using ImageJ software. Data shown are means ± SDs of 3 independent experiments with 3 different donors. A two-way paired ANOVA was performed (pANOVA cell type = 0.045). f DNA of hDSCs and the autologous fibroblasts were isolated and applied to real-time PCR to quantify the mtDNA content in these cells as described in the Materials and the Methods. Data shown are means ± SDs with 4 independent experiments of 4 different donors. A two-way paired ANOVA was performed (pANOVA cell type < 0.0001). g Cellular ATP contents were measured and normalized to protein amounts in these cells, then further normalized to the ATP content in hDSCs as described in the Materials and Methods. Data are shown as means ± SDs of >5 experiments using samples from 5 different donors. An unpaired one-way ANOVA with Tukey’s multiple comparisons test was performed. h Glucose consumption and lactate production were measured and the bioenergetics of these cells was calculated as described in the Materials and Methods. Data shown are means ± SDs with 3 independent experiments of 3 different donors. An unpaired one-way ANOVA with Tukey’s multiple comparisons test was performed. i hDSCs were co-stained with NESTIN and the mitochondrially localizing proteins, MTC02 or SSBP1. Images were prepared with the confocal microscope. Scale bars: 20 μm. The staining intensities of these proteins were quantified by ImageJ software and are represented by the integrated density (ID). Dots and squares in the graphs represent single cells of hDSCs or fibroblasts respectively. Data shown are means ± SDs with 3 independent experiments of 3 different donors. P values were obtained with Mann–Whitney test. j hDSCs and fibroblasts were stained with JC-1 to investigate the Δψm. Data shown are means ± SDs of 5 independent experiments with 5 different donors. An unpaired one-way ANOVA with Tukey’s multiple comparisons test was performed

