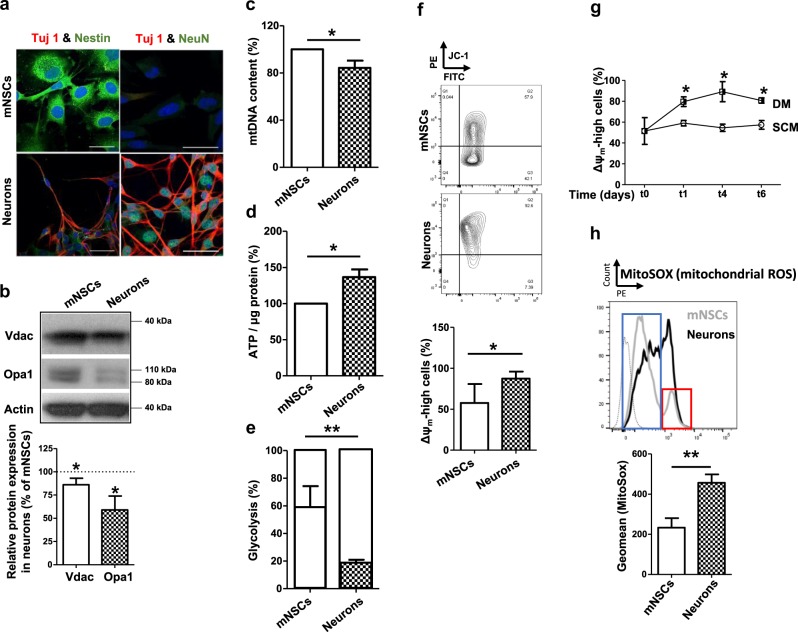
Fig. 2.
mNSCs contain a higher amount of mitochondria than differentiated neurons and are composed of two distinct cell populations with either low or high Δψm. a mNSCs express Nestin and are able to differentiate to Tuj1 and NeuN double positive neurons. Scale bars: 50 µm. b Proteins were isolated from mNSCs and their differentiated neurons and protein expression assessed with Western blotting. Quantification was done with ImageJ software by measuring the intensity of the bands detected. The relative expression of Vdac and Opa1 were normalized to expression in mNSCs (see diagram on the right). Data shown are means ± SDs of 3 independent experiments. An unpaired, two-tailed student t test was performed. c Total cellular DNA was isolated from mNSCs and their differentiated neurons, and analyzed with qPCR. Data shown are means ± SDs of 3 independent experiments. An unpaired, two-tailed student t test was performed. d ATP levels in mNSCs and differentiated neurons were measured as described in Materials and Methods. Data shown are means ± SDs of 3 independent experiments. An unpaired, two-tailed Student's t test was performed. e Cellular bioenergetics of mNSCs and differentiated neurons were calculated by measuring glucose consumption and lactate production. Data shown are means ± SDs of 3 independent experiments. An unpaired, two-tailed Student's t test was performed. f Mitochondrial polarization was detected by staining cells with JC-1 in mNSCs in comparison with differentiated neurons. Data shown are means ± SDs of 3 independent experiments. An unpaired, two-tailed student t test was performed. g Δψm was detected by staining cells with JC-1 during neuronal differentiation at different time points. DM differentiation medium. SCM: stem cell medium. Data shown are means ± SDs of 3 independent experiments. An unpaired, two-tailed Student's t test was performed. h Mitochondrial ROS was measured by staining cells with MitoSox (5 µM) at 37 °C for 25 min and assessed by FACS. The geometric means are presented as means ± SDs of more than 3 independent experiments. An unpaired, two-tailed Student's t test was performed. mNSCs show two subpopulations of cells exhibiting either high, or low mitochondrial ROS (red and blue rectangles)

