Fig. 3.
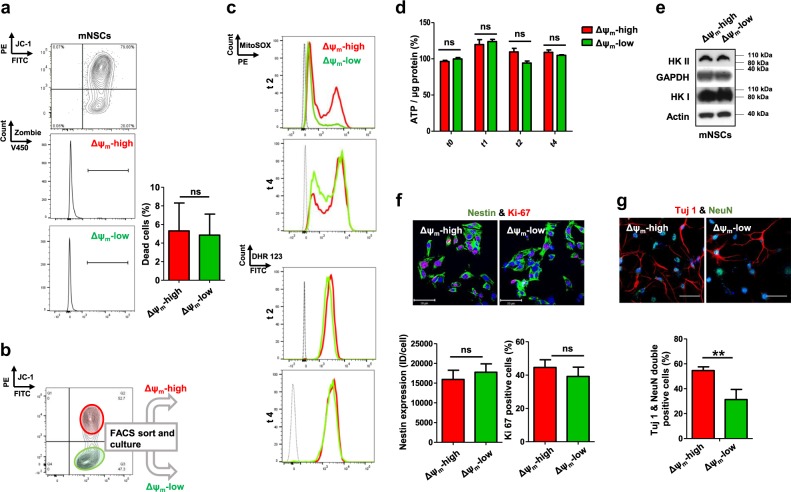
High-Δψm mNSCs produce more ROS and show enhanced neuronal differentiation capacity as compared to the low-Δψm mNSCs. a mNSCs were stained with JC-1 and Zombie. The Zombie positive cells (dead cells) were compared between the gated PE-positive (Δψm-high) and the gated PE-negative (Δψm-low) cell populations. Data shown are means ± SDs of 3 independent experiments. An unpaired, two-tailed student t test was performed. b mNSCs were FACS-sorted according to their Δψm and cultured in corresponding stem cell or neuronal differentiation medium. c Mitochondrial and intracellular levels of ROS were measured by staining the FACS-sorted cells (Δψm-low and Δψm-high) with MitoSox and DHR, respectively. d mNSCs were FACS-sorted according to Δψm and ATP content in the cells was measured over time. Data shown are means ± SDs of one representative experiment. e Cell lysates were extracted from the Δψm-low and Δψm-high mNSCs and applied for Western blot analysis. f FACS-sorted cells were stained for Nestin and Ki-67 and assessed by confocal microscopy. The intensity of Nestin was quantified as ID per cell and the percentage of Ki-67-positive cells was obtained by counting more than 200 cells. Scale bars: 50 µm. Data shown are means ± SDs of 3 independent experiments. An unpaired, two-tailed Student's t test was performed. g FACS-sorted cells were cultured in neuronal differentiation medium for 7 days and the neuron markers, Tuj1 and NeuN were stained. Expression of these markers were observed with confocal microscopy and the double-positive cells (neurons) were quantified by evaluating more than 200 cells. Scale bars: 50 µm. Data shown are means ± SDs of 3 independent experiments. An unpaired, two-tailed Student's t test was performed

