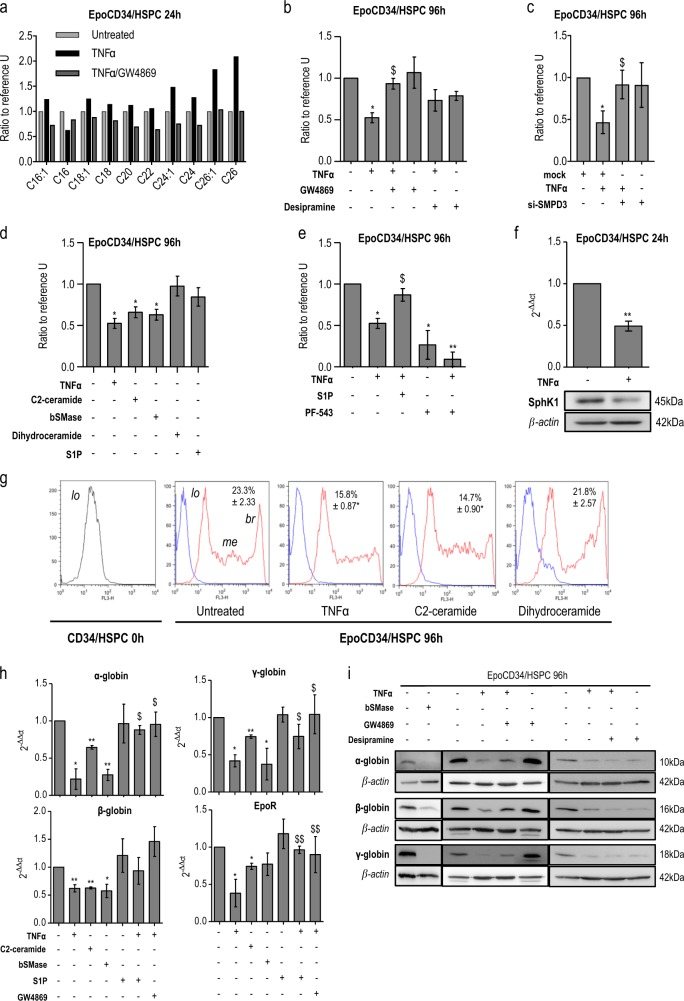
Fig. 1.
a Mass spectrometry analysis of C16-, C16:1-, C18-, C18:1-, C20-, C22-, C24-, C24:1-, C26-, and C26:1-ceramide in EpoCD34/HSPCs treated with TNFα and GW4869 for 24 h. Ceramide species were quantified by ESI-MS/MS and results were reported to the number of cells. EpoCD34/HSPCs (Epo: 2 U/mL) were untreated (U) or treated as indicated with TNFα, GW4869, desipramine, C2 ceramide, bSMase, dihydroceramide, sphingosine-1-phosphate (S1P), or PF-543 or transfected with si-SMPD3. b Benzidine staining assays with sphingomyelinase inhibitors at 96 h. c Benzidine staining assays with si-SMPD3 at 96 h. d Comparison of TNFα effect on benzidine staining assays at 96 h with ceramides and its derivatives. e Benzidine staining assays with S1P and PF-543 at 96 h. f Real-Time PCR and Western blot analysis of SphK1 expression at 24 h. g Flow cytometry analysis of GPA expression. GPA-expressing populations were identified as low (lo), medium (me), and bright (br). Mean of percentage ± SD of GPAbright cells is indicated in each quadrant. h Real-time PCR analysis of globins and EpoR expression at 96 h. i Western blot analysis of globin's expression at 96 h. Bars represent the mean ± SD of four independent experiments except for f with three independent experiments. One-way ANOVA with repeated measures followed by Dunnett’s post hoc test show the statistical significance *,$P < 0.05, **,$$P < 0.01 (*: treatment vs. untreated; $: treatment vs. TNFα). A Student’s t test was performed for f. β-Actin expression was used in Western blot analyses as an internal control and was revealed each time on the same membrane than one or several proteins of interest

