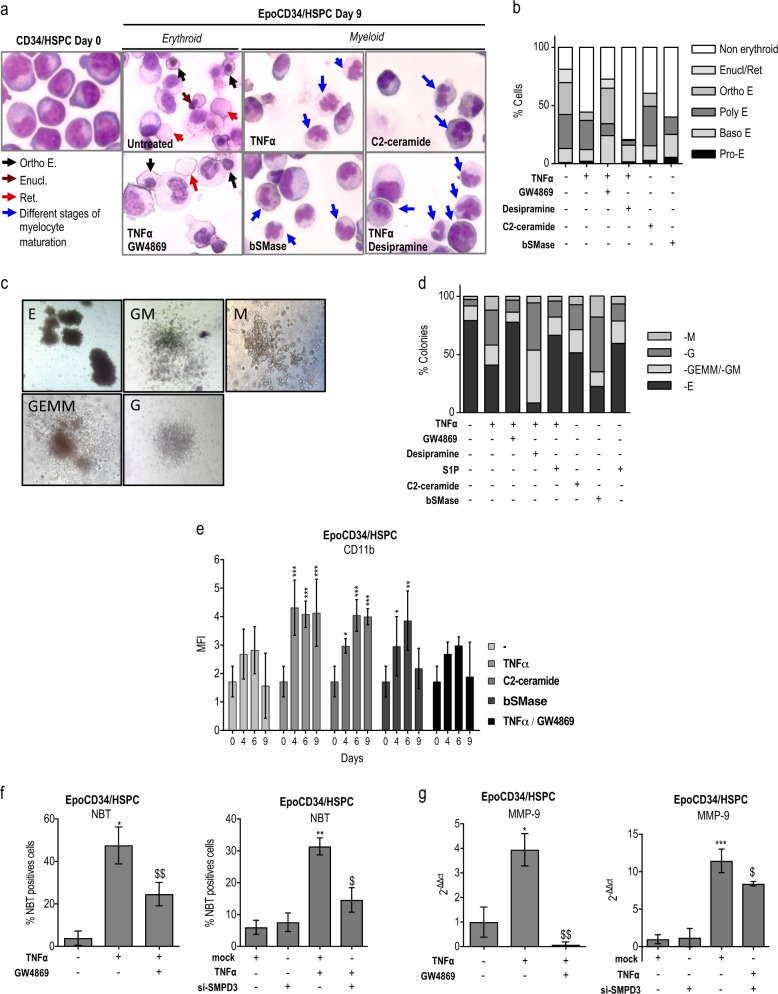
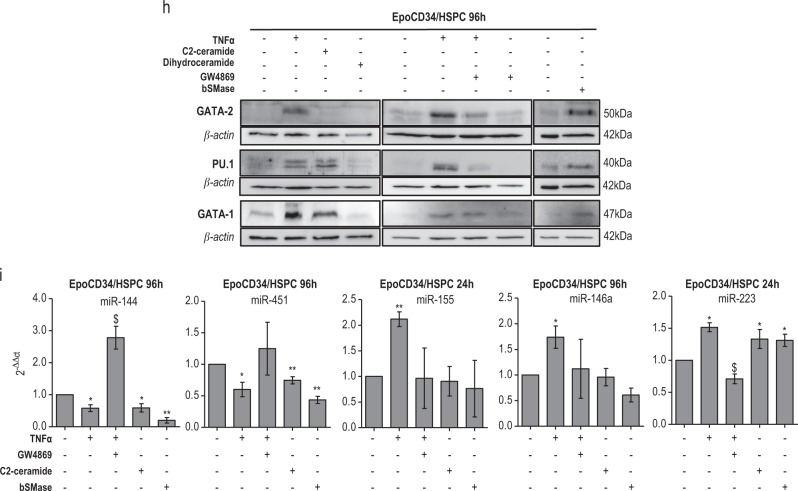
Fig. 2.
Impact of TNFα/SMase/ceramide pathway on EpoCD34/HSPCs differentiation. a May–Grünwald–Giemsa staining of CD34/HSPCs at day 0 and EpoCD34/HSPCs at day 9 of treatment observed with a ×40 objective. Each picture is representative of three independent experiments. Enucl/Ret: enucleation/reticulocyte; E: erythroblast; Ortho: orthochromatophilic. b Representation of the different cell types distribution on MGG-stained slides. c Microscope observation (×20) of distinctive morphological aspects of hematopoietic colonies obtained after EpoCD34/HSPCs treatments at day 14. E: erythroid; GM: granulocyte–monocyte; GEMM: granulocyte–erythrocyte–monocyte–megakaryocyte; G: granulocyte; M: monocyte/macrophage. d Representation of the different colonies distribution in colony formation assays of EpoCD34/HSPCs treatments at day 14. e Flow cytometry analysis of CD11b expression in EpoCD34/HSPCs from day 0 to 9 of culture. f NBT staining with GW4869 and si-SMPD3 at 96 h. g Real-time PCR analysis of MMP-9 expression with GW4869 and si-SMPD3 at 96 h. h Western blot analysis of GATA-1, GATA-2, and PU.1 in EpoCD34/HSPCs after 96 h of treatment. β-Actin expression was used in Western blot analyses as an internal control and was revealed each time on the same membrane than one or several proteins of interest. i Real-time PCR analysis of miR-144, -451, -155, -146a, and -223 expression levels in EpoCD34/HSPCs. Bars represent the mean ± SD of five independent experiments. One-way ANOVA with repeated measures followed by Dunnett’s post hoc test or two-way ANOVA followed by Holm–Sidak’s post hoc test show the statistical significance *,$P < 0.05, **P < 0.01, ***P < 0.001 (*: treatment vs. untreated, $: treatment vs. TNFα)


