Fig. 3.
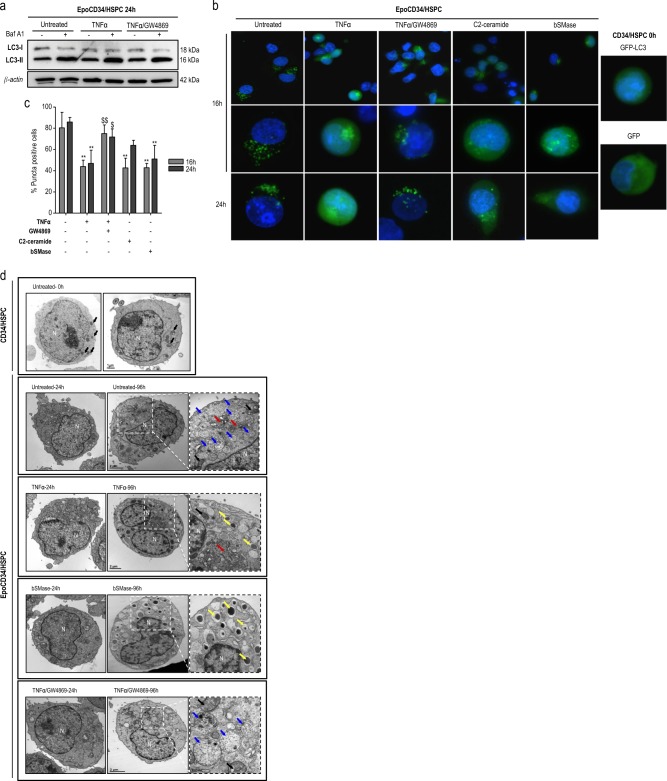
Impact of TNFα/SMase/ceramide pathway on EpoCD34/HSPCs autophagy. a Western blot analysis of LC3 conversion in EpoCD34/HSPCs treated as indicated for 24 h. BafA1: bafilomycin A1. β-Actin expression was used in Western blot analyses as an internal control. b Fluorescence microscopy observations of Epo-free or EpoCD34/HSPCs after nucleofection with pSelect-GFP-LC3 plasmid or with GFP control plasmid and treatments as indicated for 0, 16, and 24 h. Nuclei were stained with 4′,6-diamidino-2-phenylindole (DAPI). Two lower rows show magnified cells representative of the transfected population (×40); in row 1, cells are shown in a larger field at 24 h (×20). c Quantification of transfected viable cells that display punctae pattern without diffuse signal. Bars represent the mean ± SD of three independent experiments. Two-way ANOVA followed by Holm–Sidak’s post hoc test show the statistical significance *,$P < 0.05, **,$$P < 0.01 (*: vs. untreated, $: vs. TNFα). d TEM pictures of untreated CD34/HSPCs at 0 h and of untreated or treated as indicated EpoCD34/HSPCs at 24 h and 96 h. N: nucleus; blue arrows: autophagosome/autolysosome, black arrows: mitochondria, red arrows: Golgi, yellow arrows: dense-core early azurophilic granules and secretion vesicles

