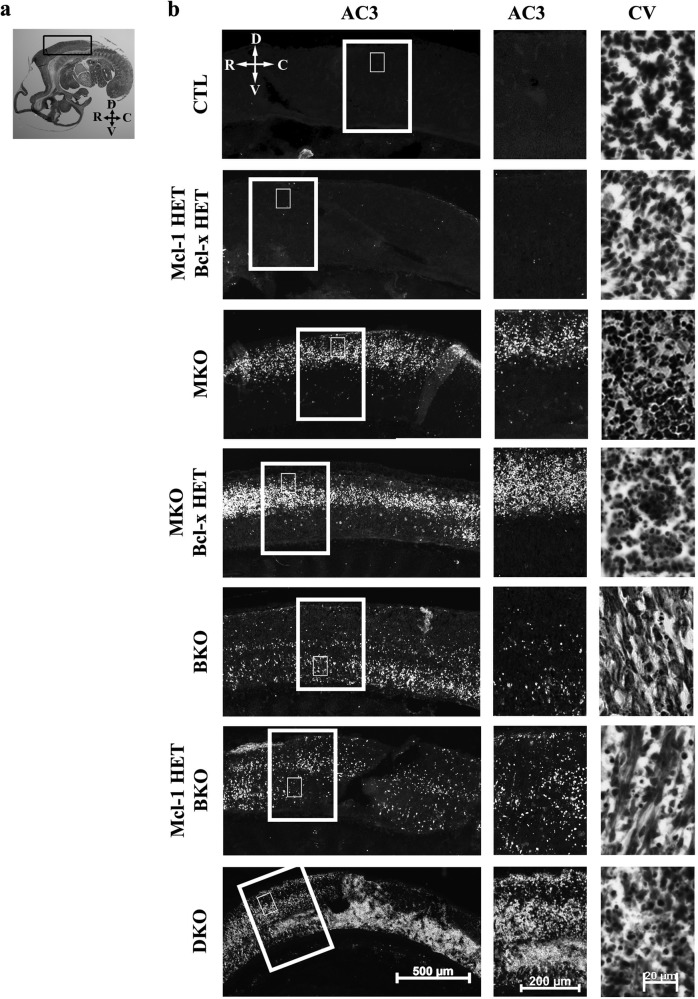
Fig. 4.
Gene dosage affects the onset of apoptosis in the spinal cord. a Photomicrograph of a cresyl violet stained sagittal section through an E11 mouse embryo. Black box indicates region of spinal cord examined. b Representative photomicrographs of sagittal spinal cord sections from E11 CTL, Mcl-1 HET:Bcl-x HET, MKO, MKO:Bcl-x HET, BKO, Mcl-1 HET:BKO, and DKO animals (n = a minimum of 3/genotype). Apoptotic cells are labeled with active caspase-3 (AC3) immunohistochemistry, while cresyl violet staining shows tissue histology. Larger boxed area in b indicates region of higher magnification photomicrographs for active caspase-3 stained sections, while smaller inset indicates region shown in cresyl violet photomicrographs. R rostral, C caudal, D dorsal, V ventral

