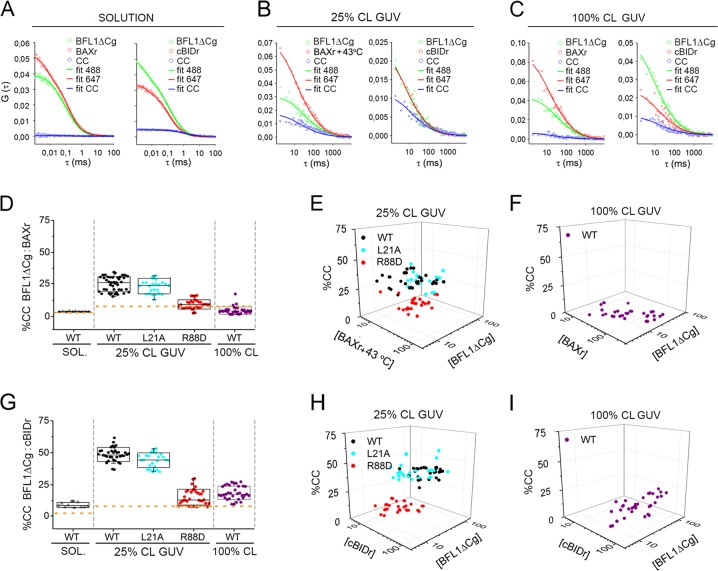
Fig. 2.
Assessment of BFL1∆C heterocomplex formation. a, b, c FCCS analysis of BFL1∆Cg:BAXr and BFL1∆Cg:cBIDr heterocomplexes in solution, in 25%CL GUV, and in 100%CL GUV. Dots represent raw data; straight lines, fitted auto-correlation curves (green and red), and cross-correlation curves (blue). d, g Quantification of BFL1ΔCg heterocomplexes. Box chart representations as described in Fig. 1b. Dashed orange lines indicate the minimum %CC considering heterodimer formation and the degree of labeling. e, f, h, i Heterocomplex formation in individual GUV represented on a 3D plot as a function of protein concentrations (molecules/µm2). All data correspond to at least three independent experiments, with more than 20 GUV analyzed for each condition. Error bars, SD

