Fig. 5.
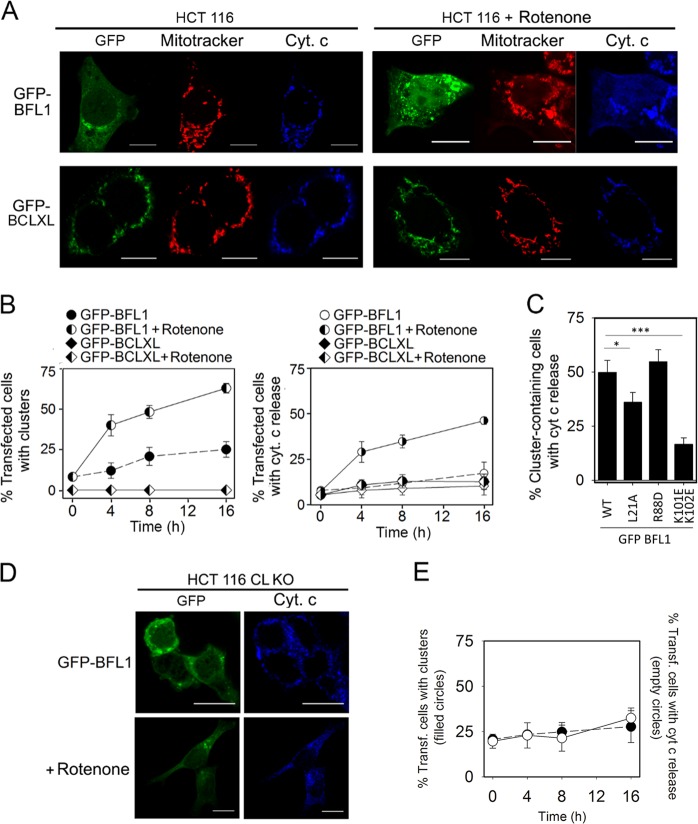
Effects of rotenone in HCT116 cells transfected with GFP-BFL1 or GFP-BCLXL. a Representative images of GFP-BFL1 and GFP-BCLXL intracellular distribution (green), cyt c localization (blue) and mitotracker intensity (red) in transfected HCT116 cells treated or untreated with rotenone (1 µM, 4 h). Scale bars, 10 µm. b Time-dependence of cluster formation and cyt c release in transfected HCT116 cells treated or untreated with rotenone (1 μM). c Quantification of the percentage of transfected cells presenting clusters and cyt c release after rotenone treatment (1 µM, 4 h). *p = < 0.05; ***p = < 0.001. d Representative images of GFP-BFL1 and cyt c intracellular distribution in HCT116 CL KO cells treated or untreated with rotenone (1 μM, 4 h). e Time-dependence of cluster formation (left) and cyt c release (right) in transfected HCT116 CL KO cells treated or untreated with rotenone (1 μM). In (b, c, e) at least 50 cells were analyzed per condition, and all the experiments were performed at least three times. Data are expressed as mean ± SD

