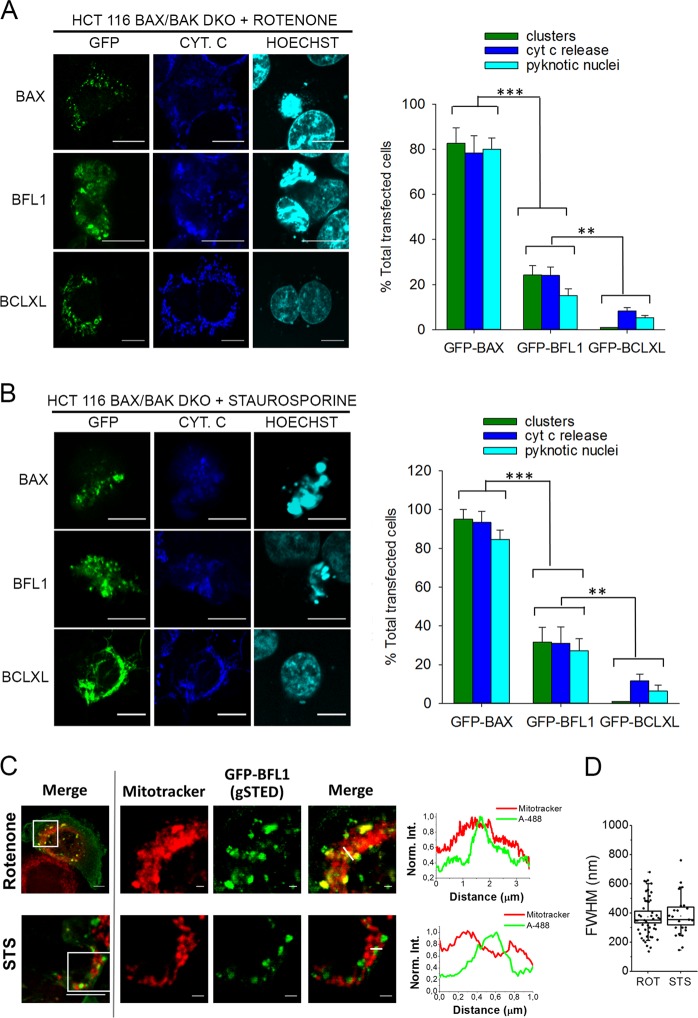
Fig. 6.
Effects of rotenone and staurosporine in HCT116 BAX/BAK DKO cells transfected with GFP-BFL1, GFP-BCLXL, or GFP-BAX. a, b Left, representative images of GFP-BAX, GFP-BFL1 and GFP-BCLXL intracellular distribution (green), cyt c localization (blue) and nuclear morphology (cyan) in transfected HCT116 BAX/BAK DKO cells treated with rotenone or staurosporine (1 µM, 6 h). Scale bars, 10 µm. Right, percentage of transfected HCT116 BAX/BAK DKO cells presenting clusters, cyt c release, or apoptotic nuclei after rotenone or staurosporine treatment (1 µM, 6 h). Data represent mean ± SD from three independent experiments (n > 50 on each repetition). c Left, representative merged images of rotenone- or staurosporine-treated HCT116 BAX/BAK DKO cells presenting GFP-BFL1 clusters. Scale bars, 5μm. The boxed regions of interest were zoomed out and recorded for confocal (mitotracker) and gSTED (GFP-BFL1-Alexa 488) observation. Scale bars, 1μm. Right, normalized intensity profiles of GFP-BFL1-Alexa 488 and Mitotracker along the pixels marked by the line on the zoomed merged images. d Spatial resolution (FWHM) of GFP-BFL1 clusters in the gSTED recorded images. Box chart representation as described in Fig. 1b

