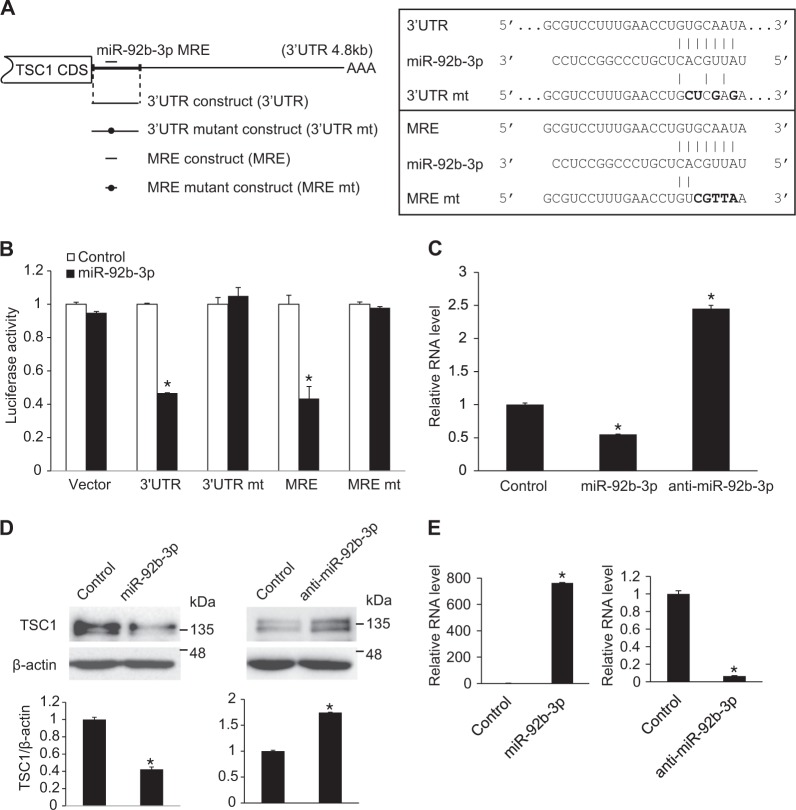
Fig. 5.
TSC1 is a target of miR-92b-3p. a (Left panel) Schematic diagram of predicted miR-92b-3p MRE in the 3′-UTR of TSC1 transcripts and luciferase reporter constructs used for luciferase assays. CDS and AAA stand for protein coding sequence and poly(A) tail, respectively. Mutations introduced in the MRE to disrupt a base paring with miR-92b-3p sequence are indicated as black circles. (Right panel) Sequences of the 3′-UTR, the 3′-UTR mt, the wild-type miR-92b-3p MRE in the 3′-UTR of TSC1 (MRE) and the MRE mt cloned into the 3′-UTR of the luciferase gene are shown. The mutated sequence is in bold. Perfect base matches are indicated by a line. b Luciferase activity of constructs, such as the 3′-UTR, the 3′-UTR mt, the MRE and MRT mt, were examined in Cos7 cells by transfecting control or miR-92b-3p mimic. A luciferase vector without 3′-UTR sequence (Vector) was used as a negative control. Data represent the mean ± S.E. of triplicates. *p < 0.05. c. Levels of endogenous TSC1 mRNA relative to 18S rRNA were quantified by qRT-PCR analysis in PASMCs transfected with control mimic, miR-92b-3p mimic, or anti-miR-92b-3p. Data represent the mean ± S.E. of triplicates. *p < 0.05. d Immunoblot analysis of TSC1 and β-actin using cell lysates of PASMCs transfected with control mimic, miR-92b-3p mimic or anti-miR-92b-3p were performed. Protein bands were quantitated by densitometry, and relative amounts of protein normalized to β-actin are presented. *p < 0.05. e Levels of endogenous miR-92b-3p relative to U6 snRNA were quantified by qRT-PCR analysis in PASMCs transfected with control mimic, miR-92b-3p mimic, or anti-miR-92b-3p. Data represent the mean ± S.E. of triplicates. *p < 0.05

