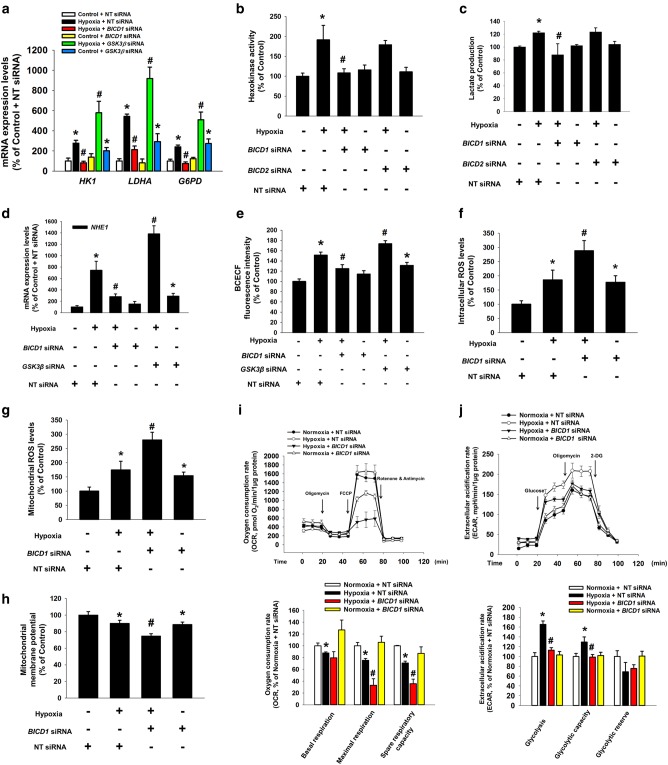
Fig. 5.
Role of BICD1 or GSK3β in glycolysis and ROS accumulation in UCB-MSCs under hypoxia. (a–e, i, j) The UCB-MSCs were transfected BICD1, BICD2, GSK3β, or NT siRNA for 24 h prior to hypoxia treatment for 24 h. a mRNA expression levels of HK1, LDHA, and G6PD were analyzed by quantitative real-time PCR. n = 5. Gene expression levels were normalized by 18S rRNA expression level. b, c Hexokinase activity and lactate production in cells were analyzed by using commercial kit. n = 6. d mRNA expression level of NHE1 was analyzed by quantitative real-time PCR. n = 5. Gene expression levels were normalized by 18S rRNA expression level. e Intracellular alkalization was measured by BCECF-AM staining. n = 8. f–h The UCB-MSCs were transfected BICD1, GSK3β, or NT siRNA for 24 h prior to hypoxia treatment for 48 h. Intracellular ROS, mitochondrial ROS, and mitochondrial membrane potential of cells were measured by luminometer. n = 8. i Oxygen consumption rate (OCR) changes under mitochondrial stress test in UCB-MSCs under normoxia or hypoxia were measured by using Seahorse XF24 Extracellular Flux analyzer. n = 5. Statistics of basal respiration, maximal respiration, and spare respiratory capacity were presented in lower panel. j Extracellular acidification rate (ECAR) changes under glycolysis stress test in UCB-MSCs under normoxia or hypoxia were measured by using Seahorse XF24 Extracellular Flux analyzer. n = 5. Statistics of glycolysis, glycolytic capacity, and glycolytic reserve were presented in lower panel. Quantitative data are presented as a mean ± S.E.M. *p < 0.05 vs. normoxia control with NT siRNA transfection, #p < 0.05 vs. hypoxia with NT siRNA transfection

