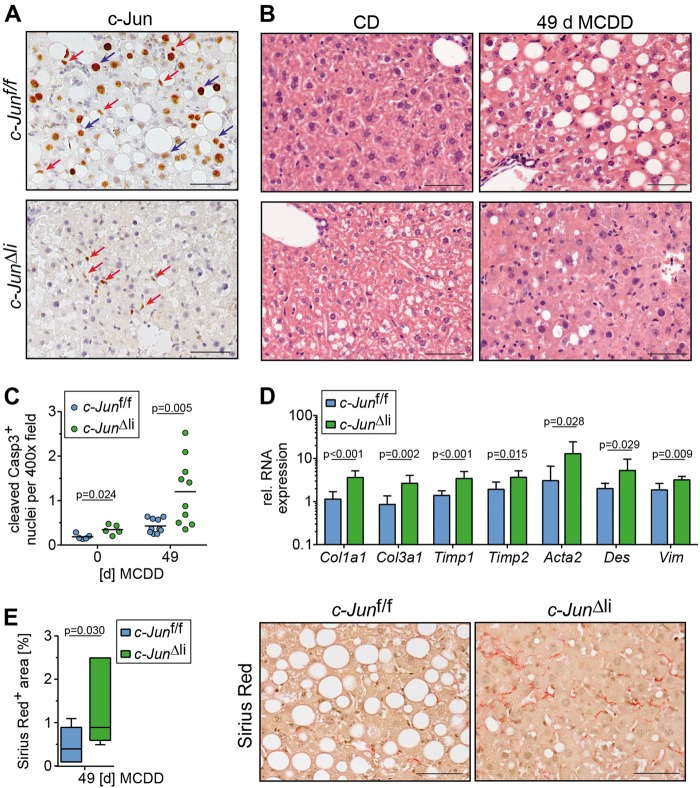
Fig. 2.
Increased fibrosis in MCDD-fed c-Jun∆li mice. a, b Representative immunohistochemistry for c-Jun following 49 days of MCDD feeding (a) and hematoxylin and eosin (H&E) stainings following 0 and 49 days of MCDD feeding (b) of livers from mice with the indicated genotypes. Nuclei of hepatocytes and NPLCs are depicted by blue and red arrows, respectively. c Cells with caspase 3 cleavage were assessed by immunofluorescence and quantified (n = 5-10/genotype and timepoint). d Hepatic mRNA expression of the indicated genes following 49 days of MCDD (n = 5-8/genotype). mRNA expression is shown relative to untreated controls. e Quantification and representative Sirius Red stainings following 49 days of MCDD (left, n = 7/genotype). Significance was tested by Mann–Whitney test. P-values are indicated if significant. Scale bar = 50 µm

