Fig. 5.

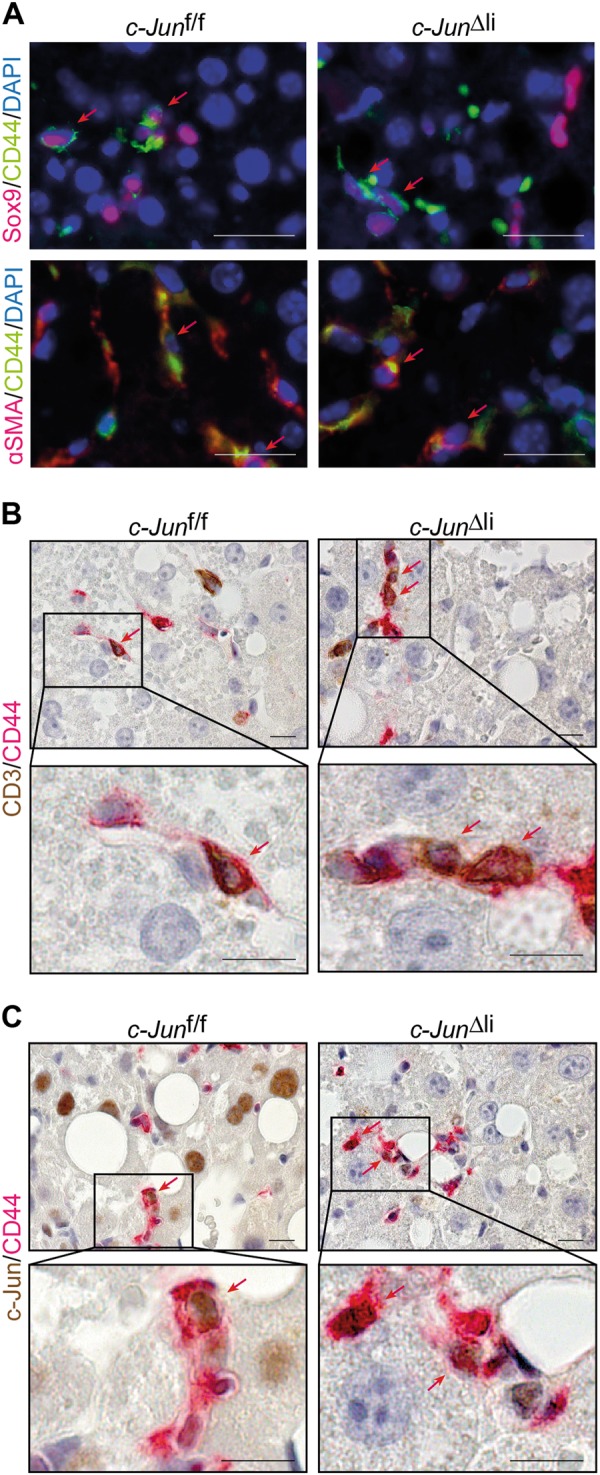
Expression analysis of CD44-positive NPLCs. a Representative double-immunofluorescence stainings for CD44 (green) and Sox9 (red) (upper panel) or αSMA (red) (lower panel) of livers from mice with the indicated genotypes following 49 days of MCDD feeding. b, c Representative immunohistochemistry of CD44 (red) and CD3 (b = brown) or c-Jun (c = brown) double-positive cells of livers from mice with the indicated genotypes following 49 days of MCDD feeding. Double-positive cells are indicated by red arrows. Scale bar (immunofluorescence) = 25 µm. Scale bar (immunohistochemistry) = 10 µm
