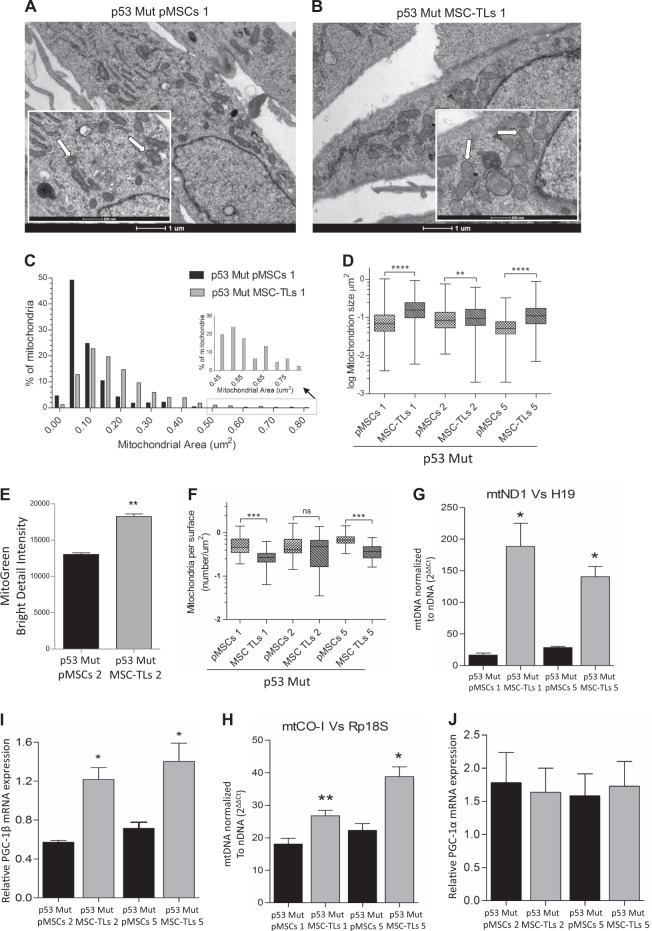
Fig. 4.
Mutant p53 MSC-TLs display increased mitochondrial mass. a, b Representative EM micrographs of p53Mut-MSC-TLs 1 and p53Mut-pMSCs1 (scale bar in big and small panels, 1 µM and 500 nm, respectively). Arrows indicates representative mitochondria. c Distribution of mitochondria areas in EM micrographs of p53Mut-MSC-TLs compared to p53Mut-pMSCs. d Quantitation of the EM micrographs (at least 30 images per sample), show increased mitochondrial size in p53Mut-MSC-TLs Vs p53Mut-pMSCs. Each p53Mut-MSC-TLs was compared to the p53Mut-pMSCs they were derived from (Mann–Whitney test). e MitoTracker Green (MTG) staining was evaluated by Imaging Flow Cytometry (IFC). Two-tailed paired Student’s t test. Three independent experiments were performed. (f) Mitochondrial density expressed as number of mitochondrial per area of cytoplasm (at least 30 images per sample). g, h Quantitative PCR analysis showed that mitochondrial DNA copy number normalized to nuclear DNA copy number (mtDN1 versus H19 and mtDN2 versus Mx1) was significantly increased in p53Mut-MSC-TLs Vs p53Mut-pMSCs. Two-tailed paired Student’s t test. Three independent experiments were performed. i, j Relative mRNA expression of PGC1-β (I) and PGC-1α (j) expression levels. Data are presented as mean ± SEM of at least three independent experiments. Data in (d, f) are presented as Whiskers plot (Min to Max), Mann–Whitney test. Data in (e, g–j) are presented as mean ± SEM of three independent experiments, Two-tailed paired Student’s t test, *p < 0.05, **p < 0.01, ***p < 0.001, ****p < 0.0001

