Fig. 5.
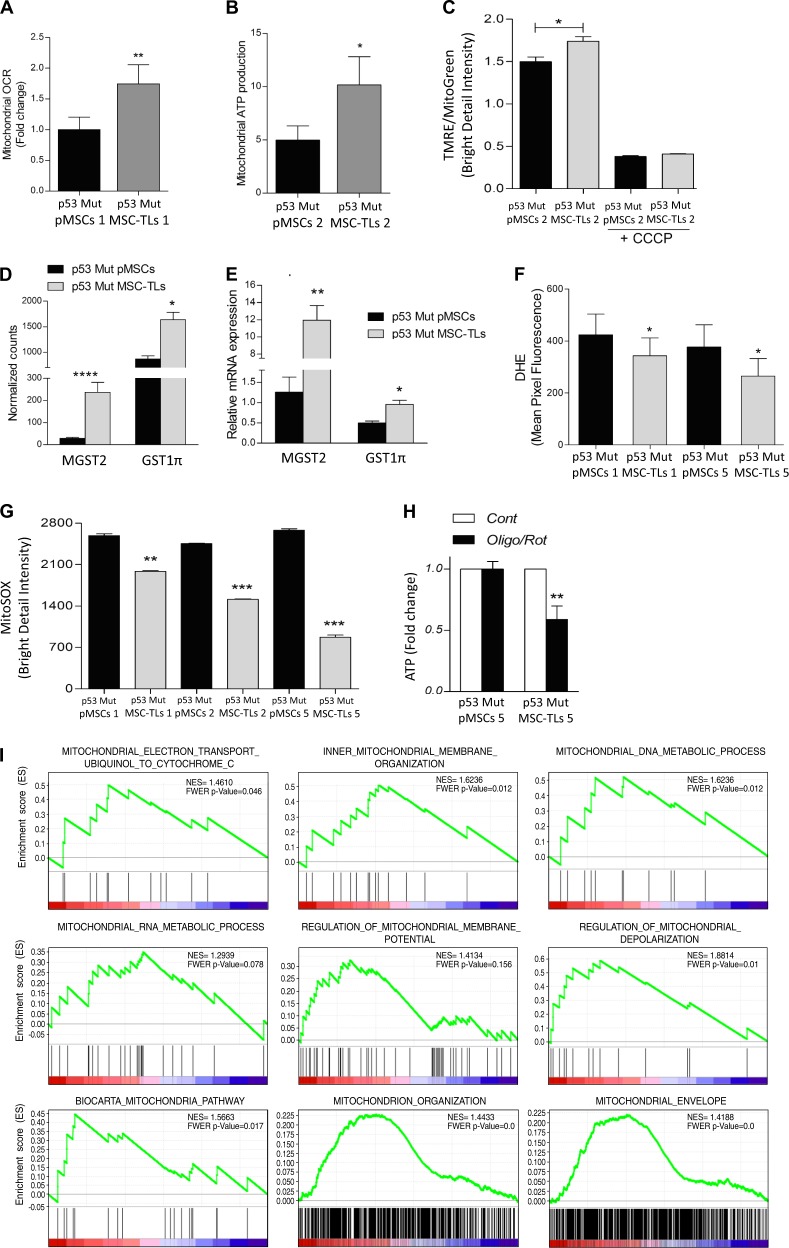
Mutant p53 MSC-TLs display increased mitochondrial oxidative metabolism a Basal Oxygen Consumption Rate (OCR) was determined using XFe96 Extracellular Flux Analyzer comparing p53Mut-MSC-TLs cultures vs. p53Mut-pMSCs. Results are normalized on cell number. b Mitochondrial ATP production (or ATP turnover) is considered as the oligomycin-sensitive respiration. c Increased mitochondrial membrane potential (TMRE staining) in p53Mut-MSC-TLs versus p53Mut-pMSCs assessed by Imaging Flow Cytometry (IFC). d Transcriptional analysis of p53Mut-pMSCs and p53Mut-MSC-TLs by RNA sequencing. Mitochondrial glutathione S-transferase 1π (GST1π) and MGST2 normalized counts. e Relative mRNA expression of GST1π and MGST2. f Ione superoxide was evaluated by DHE incubation (5 µM, for 20 minutes) by Imaging Flow Cytometry (IFC). g Ione superoxide was additionally evaluated by MitoSOX incubation (5 µM, for 40 minutes) by Imaging Flow Cytometry (IFC). h ATP content after 6 h of treatment with Oligomycin (1 µM) + Rotenone (0.5 µM). i Plots of gene distribution from GSEA analysis of RNA sequencing data generated in [10]. Highly, significant enriched gene-sets in p53Mut-MSC-TLs vs. p53Mut-pMSCs are shown here. In every thumbnail, the green curve represents the enrichment profile of the genes identified in the RNA-seq; red and blue colours represent positive and negative correlation, respectively. FWER p < 0.25 and NES are indicated in the plots. Data are presented as mean ± SEM of at least three independent experiments. Data in (d) are presented as mean ± SEM of normalized counts determined by RNA sequencing. ****p < 0.0001, **p < 0.01, *p < 0.05. Two-tailed Student’s t test

