Fig. 6.
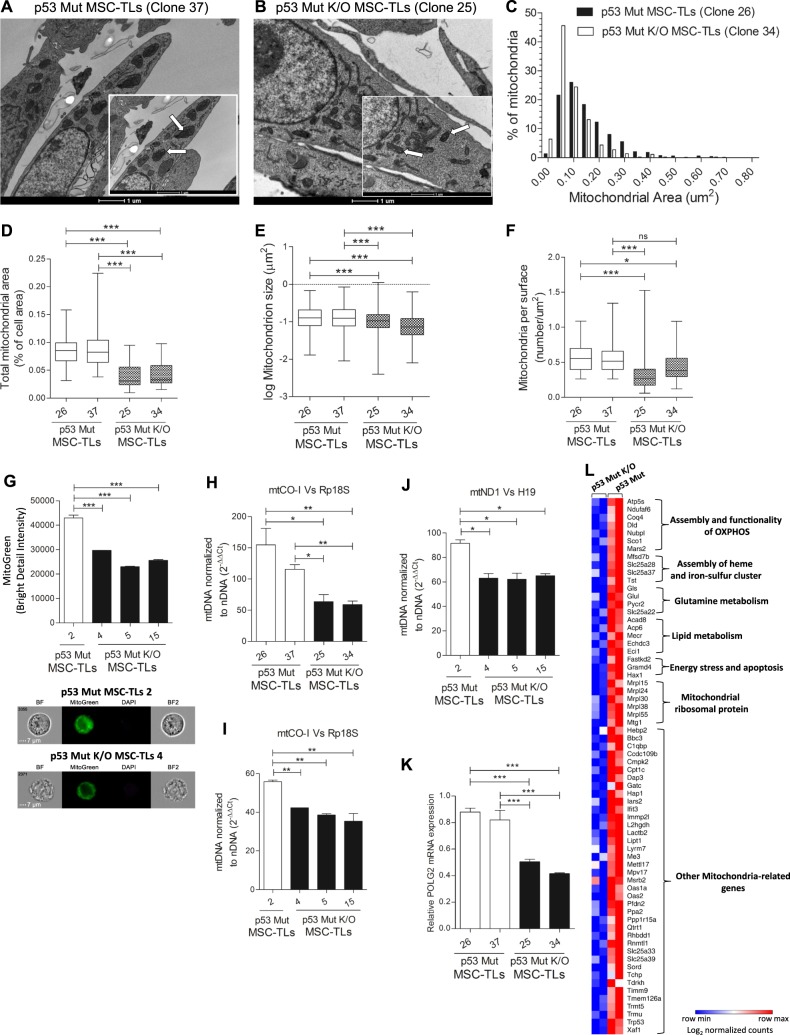
Regulation of mitochondrial mass and activity is Mutant p53-dependent. a, b Representative EM micrographs (scale bar in big and small panels, 1 µM ×9900 and 1 µM ×16,500, respectively). Arrows indicates representative mitochondria. c Distribution of mitochondria areas in EM micrographs of p53Mut-MSC-TLs compared to p53Mut K/O MSC-TLs. d Quantitation of the EM micrographs show decreased mitochondrial area (as percentage of cell area) in p53Mut K/O MSC-TLs versus p53Mut-MSC-TLs. e Quantitation of the EM micrographs show decreased mitochondrial size in p53Mut K/O MSC-TLs vs. p53Mut-MSC-TLs. f Decreased mitochondrial density (number of mitochondria per cell area) in p53Mut K/O MSC-TLs vs. p53Mut-MSC-TLs. g Mito Tracker Green (MTG) staining was evaluated by Imaging Flow Cytometry (IFC). h–j Quantitative PCR analysis of mitochondrial DNA copy number normalized to nuclear DNA copy number (mtCO-I versus Rp18S and mtND1 vs. H19). k Relative mRNA expression of POLG2. l Heat map presenting the mitochondrial gene signature that was downregulated following KO of p53Mut in MSC-TLs. Log2 normalized counts are shown. Data are presented as Whiskers plot (Min to Max). Data in (g–k) are presented as mean ± SEM of at least three independent experiments. One-way, two-sided ANOVA. *p < 0.05, **p < 0.01, ***p < 0.001

