Fig. 3.
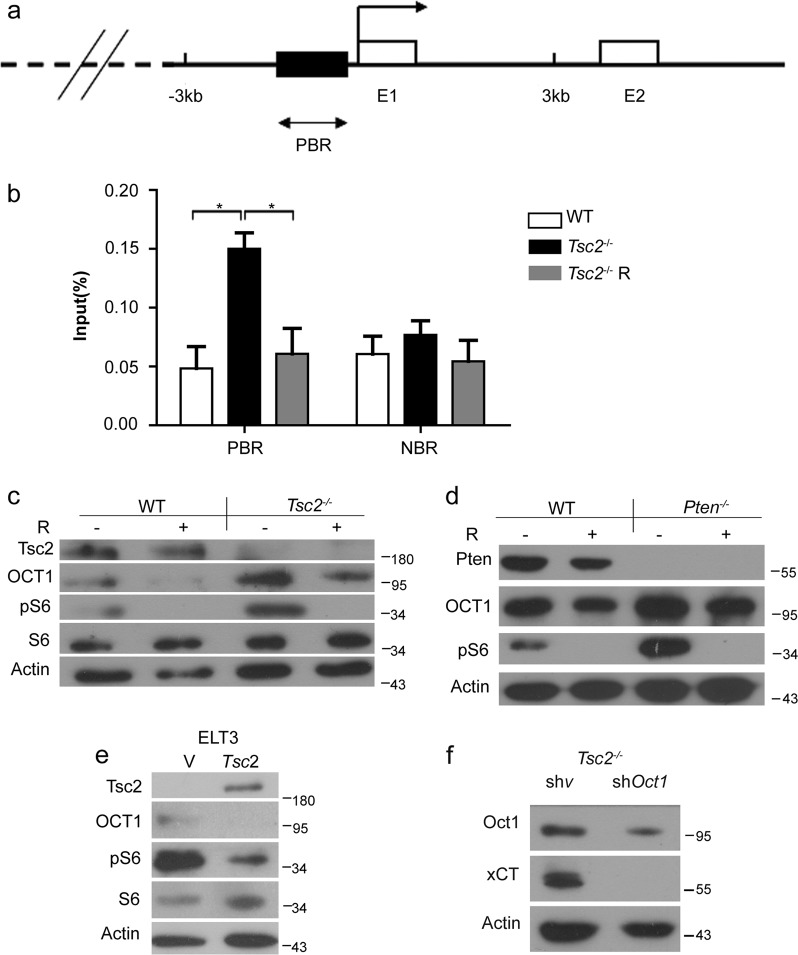
mTORC1 stimulates xCT expression through induction of Oct1. a Schematic representation of the promoter of mouse Slc7a11 gene. E1 and E2, Slc7a11 exon 1 and 2; dark rectangle, predicted Oct1 binding region; PBR, predicted binding region; NBR, nonspecific binding region; two-way arrows, fragments amplified in ChIP real-time PCR analysis. The transcription start site is indicated by an arrow above the gene. b Tsc2−/− MEFs treated with or without 10 nM rapamycin (R) for 24 h. Oct1 antibody-precipitated DNA was PCR amplified for regions indicated in A. NBR was negative control region in Chromosome 9. The data are plotted as the ratio of immunoprecipitated DNA subtracting nonspecific binding to IgG vs. total input DNA. Representative data from two independent experiments are shown. Data represent mean ± SEM of replicate real-time PCR. *P < 0.05. Immunoblotting analysis for WT and Tsc2−/− (c), or Pten−/− (d) MEFs treated with or without 10 nM rapamycin (R) for 24 h. e Immunoblotting of ELT3 cell line and its human TSC2 revertant. f Tsc2−/− MEFs were transfected with shOct1 or scramble shRNA (shv) in GPU6/Hygro vector and then subjected to immunoblotting

