Fig. 1.
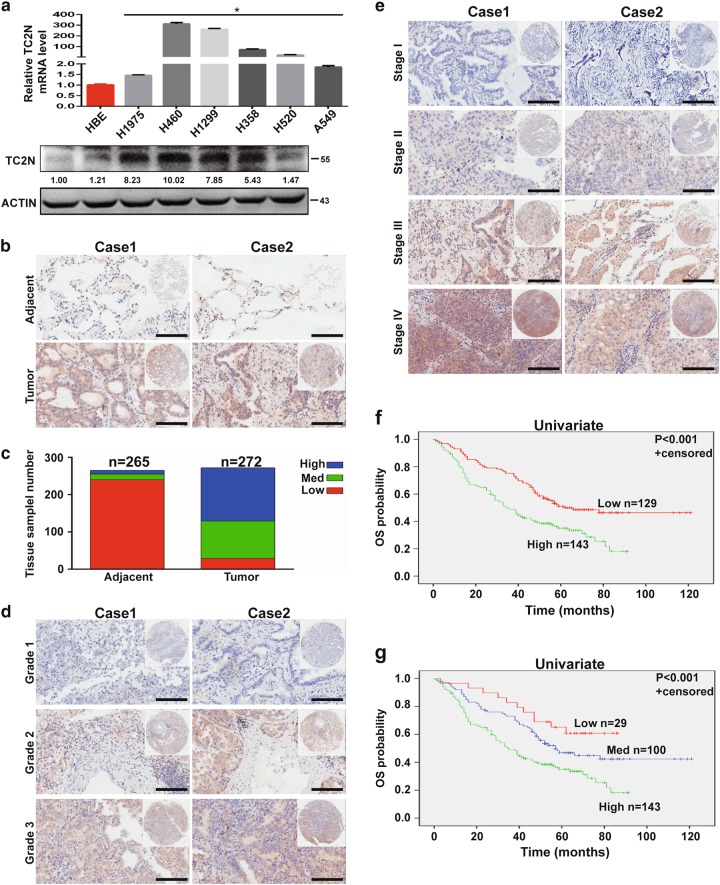
The expression level of TC2N is correlated with lung cancer progression. a The measurements of TC2N expression in lung cancer cell lines compared with the normal cell line HBE by qRT-PCR and WB. ACTIN is shown as a loading control. The data were analyzed using the formula 2‒Δct. Data represent the mean ± SD of triplicates. b, c The protein expression of TC2N in adjacent and tumor lung samples monitored by immunohistochemistry (IHC) on a tissue array. The anti-TC2N antibody was employed for IHC. IHC scoring was performed blind, prior to association with clinical data. d IHC analysis on a tissue array of lung cancers at different histological grades. e Immunohistochemistry analysis on a tissue array of lung cancers at different clinical stages. Scale bars represent 50 μm. f Kaplan–Meier analysis of TC2N expression in 272 lung cancer patients subdivided into two groups. g Kaplan–Meier analysis of TC2N expression in 272 lung cancer patients subdivided into three groups *P < 0.05

