
. 2018 Apr 30;84(1):139–150. doi: 10.29024/aogh.20
Copyright: © 2018 The Author(s)
This is an open-access article distributed under the terms of the Creative Commons Attribution 4.0 International License (CC-BY 4.0), which permits unrestricted use, distribution, and reproduction in any medium, provided the original author and source are credited. See http://creativecommons.org/licenses/by/4.0/.
Figure 1.
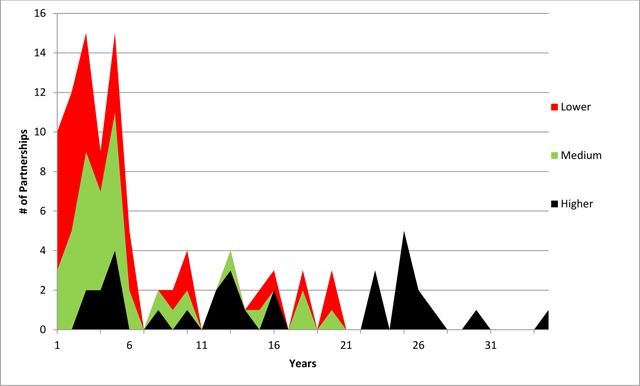
Area Graph of Partnerships by Value and Duration.