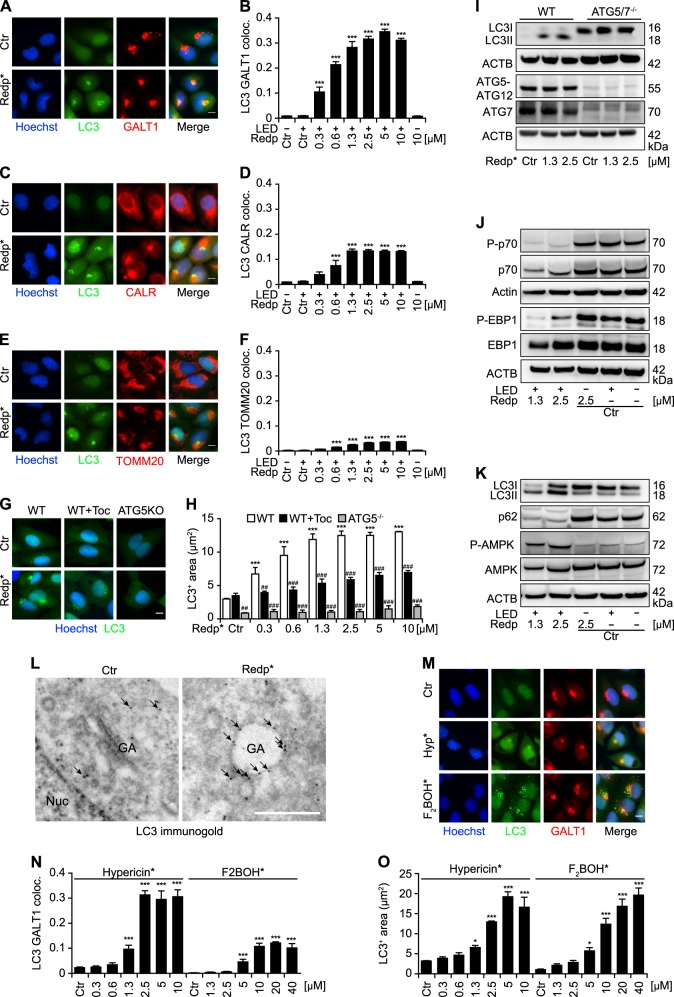
Fig. 2.
Redaporfin-PDT (redp*) induces LC3 aggregation at the Golgi apparatus (GA) and the mTOR-dependent autophagic pathway. a–f Representative images of LC3 aggregation (GFP-LC3+) and its colocalization with GA; ER; or mitochondria are shown in a, b; c, d; and e, f, respectively. Human osteosarcoma U2OS cells stably expressing GFP-LC3 were incubated with redaporfin (redp), at the indicated concentrations, for 20 h followed by irradiation (*) at 750 nm. Six hours later, immunostaining was performed for the GA marker GALT1 a, the ER marker calreticulin c, CALR, and the mitochondrial marker Tomm20 e. Data are presented as means ± SD of triplicates of one representative experiment out of two repeats. (One-way ANOVA, ***p < 0.001 versus untreated cells). Size bar equals 10 µm. g, h Representative images of LC3 aggregation in the presence of the antioxidant tocopherol (Toc) or in ATG5 KO cells. Quantitative analysis represents the average area of GFP-LC3 puncta/cell (µm2). U2OS WT and ATG5−/− cells stably expressing GFP-LC3 were incubated with redp as mentioned above. Toc (500 µM) was added to U2OS cells stably expressing GFP-LC3 4 h before irradiation and cells were fixed 6 h post irradiation. Data are presented as means ± SD of triplicates of one representative experiment out of 2–4 repeats. (Two-way ANOVA, ***p < 0.001 versus untreated cells; ##p < 0.01, ###p < 0.001 versus the presence of Toc or absence of ATG5). Size bar equals 10 µm. i–k Activation of the mTOR signaling pathway and involvement of ATG5/7 proteins in the LC3 lipidation induced by redaporfin-photodynamic therapy (PDT). Mouse embryonic fibroblasts (MEFs) WT or ATG5−/− i, and human osteosarcoma U2OS WT cells (j, k) cells were treated with redp*. Six hours post irradiation, proteins were collected and analyzed by immunoblotting for LC3 lipidation, p62 degradation, AMPK, p70, and EBP1 phosphorylation. Representative immunoblots are depicted. l Representative images of transmission electron microscopy showing vacuolization and LC3 accumulation at the GA upon redp*. Six hours after photoactivation of redp (2.5 µM) in U2OS cells expressing GFP-LC3, GFP-LC3 was detected by immunogold and analyzed by transmission electron microcopy. m–o Hypericin-PDT induces LC3 recruitment into the GA in contrast to F2BOH-mediated PDT. U2OS cells stably expressing GFP-LC3 were incubated with hypericin or F2BOH, at the indicated concentrations, for 20 h, followed by irradiation (*) and immunostaining for GALT1 at 6 h post irradiation. Representative images are shown in m, the average area of GFP-LC3+ dots per cell and the colocalization between GFP-LC3+ dots and GALT1+ structures are shown in n, o. Data indicate means ± SD of triplicates of one representative experiment out of 2–4 repeats. (one-way ANOVA, *p < 0.05, ***p < 0.001 versus untreated cells). Size bar equals 10 µm

