Fig. 3.
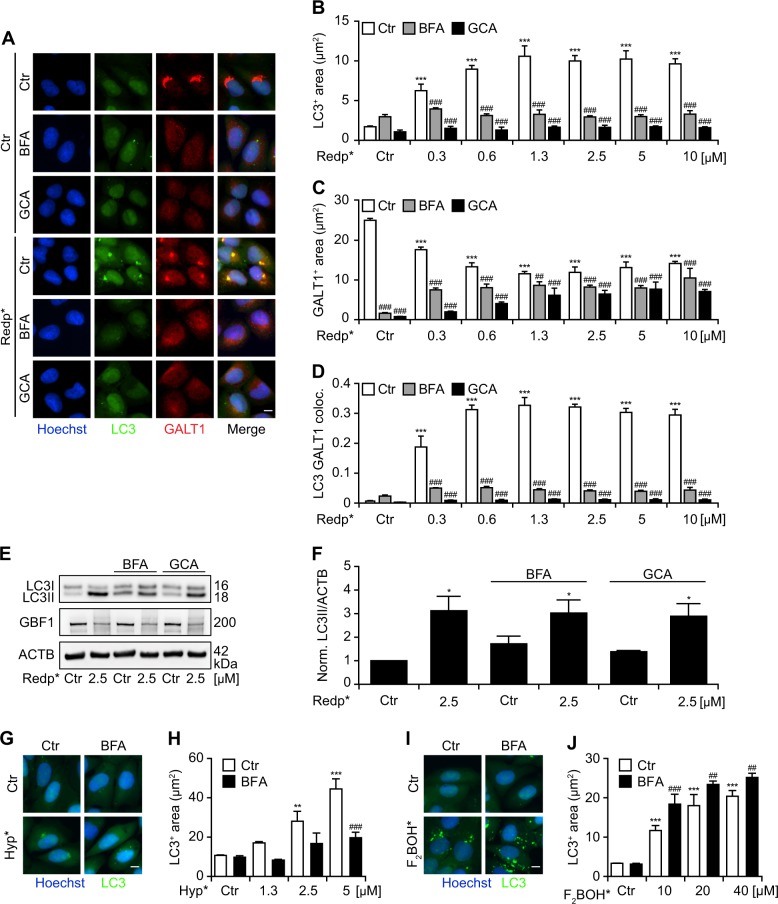
Requirement of the Golgi apparatus (GA) structure for the aggregation of LC3 in response to Redaporfin-PDT (redp*). a–d Impact of Brefeldin A (BFA) and golgicide (GCA) on the LC3 aggregation and its colocalization with the GA marker, GALT1. Human osteosarcoma U2OS cells expressing GFP-LC3 were incubated with Redp, at the indicated concentrations, for 20 h followed by addition of BFA (5 µg/mL) or GCA (5 µM). Four hours later, cells were irradiated (*) and immunostaining was performed 6 h post irradiation for the GA marker, GALT1. Representative images are shown in a and the quantitative analysis that reflects the average area of GFP-LC3+ dots and GALT1+ Golgi structures per cell are shown in b and c. The level of colocalization (co-ocurrence) between GFP-LC3 dots and GALT1+ structures is depicted in d. (Two-way ANOVA, ***p < 0.001 versus untreated cells; ###p < 0.001 versus the presence of BFA or GCA). Size bar equals 10 µm. e, f Representative immunoblot and densitometry (means ± SEM of three independent experiments) for LC3 lipidation in U2OS cells submitted to redp* in the presence of BFA or GCA. g–j Impact of BFA on the LC3 aggregation triggered by hypericin or F2BOH-mediated PDT. U2OS cells stably expressing GFP-LC3 were incubated with hypericin or F2BOH, at the indicated concentrations for 20 h followed by addition of BFA (5 µg/mL). Four hours later, cells were irradiated and at 6 h post irradiation, cells were fixed with PFA and the nuclei were counterstained with Hoechst 33342. Representative images and the quantitative analysis that reflects the average area of GFP-LC3+ dots are shown for hypericin in g, h and for F2BOH in i, j. (Two-way ANOVA, **p < 0.01, ***p < 0.001 versus untreated cells; ##p < 0.01, ###p < 0.001 versus the presence of BFA or GCA). Size bar equals 10 µm

