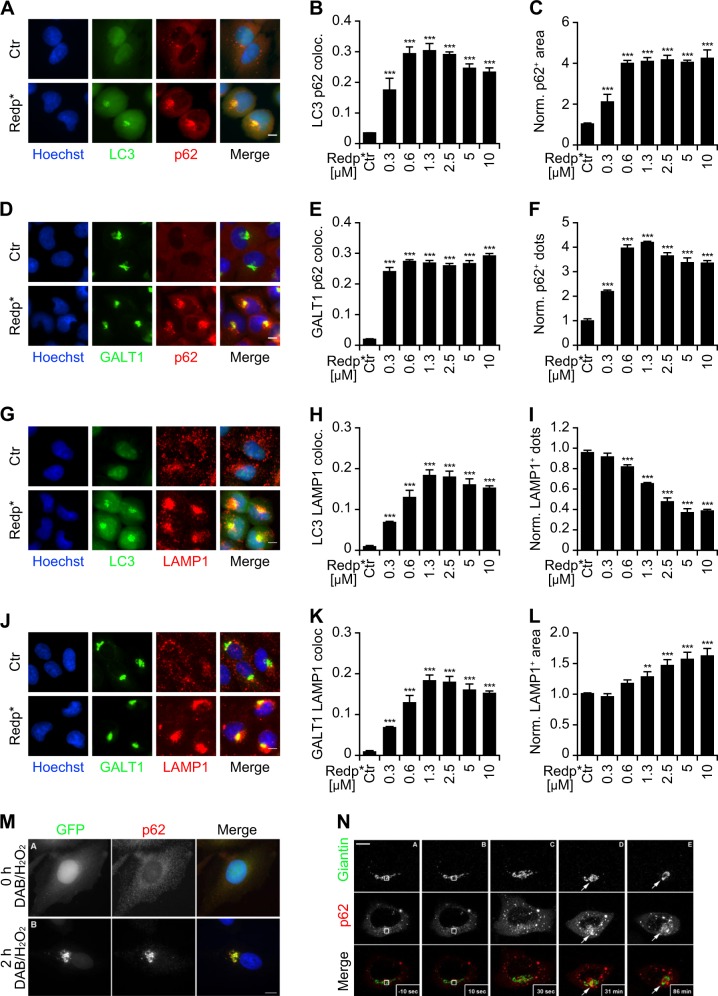
Fig. 4.
Clustering of LC3, Golgi apparatus (GA), lysosomes and p62 after Redaporfin-PDT (redp*) and DAB-H2O2 treatments. a–f Recruitment of p62 at the GA after redp*. Human osteosarcoma U2OS cells expressing GFP-LC3 or the GA marker GALT1-GFP were submitted to Redp-PDT. Six hours later, cells were immunostained for p62. Representative images of p62 aggregation at sites of LC3 aggregation and at GA structures are shown in a and d, respectively, alongside with the level of colocalization in b and e. The average number and area of p62+ structures (normalized to untreated controls) are depicted in c and f. Bars indicate means ± SD of triplicates of one representative experiment out of two repeats. (One-way ANOVA, ***p < 0.001 versus untreated cells). Size bar equals 10 µm. g–l Recruitment of lysosomes at GA after redp*. U2OS cell expressing GFP-LC3 or the GA marker GALT1-GFP were submitted to redaporfin-PDT. Six hours later, cells were immunostained for LAMP1. Representative images of LAMP1 aggregation at sites of LC3 aggregation and at GA structures are shown in g and j alongside with the level of colocalization in h and k. The average number and area of LAMP1+ structures (normalized to untreated controls) are depicted in i and l. Data indicate means ± SD of triplicates of one representative experiment out of two repeats. (One-way ANOVA, **p < 0.1, ***p < 0.001 versus untreated cells). Size bar equals 10 µm. m, n Human cervix carcinoma HeLa cells co-expressing the Golgi-targeted peroxidase ManII-HRP and GFP-LC3 cells were treated with DAB-H2O2 then either fixed or incubated in fresh complete medium for 2 h before fixation. Cells were then immunostained with anti-p62 antibody and analyzed by fluorescence microscopy m. HeLa cells expressing both GFP-Giantin and mCherry-p62 were subjected to Golgi-targeted photodamage performed by 10 seconds of irradiation with a confocal microscope equipped with a 2-photon laser. Representative images are depicted for 10 sec before photodamage A, 10 sec, B 30 sec, C 31 min D, and 86 min E after photodamage. White box indicates the photodamaged zone. White arrows show p62 recruitment to the photodamaged Golgi apparatus. Scale bar equals 10 µm

