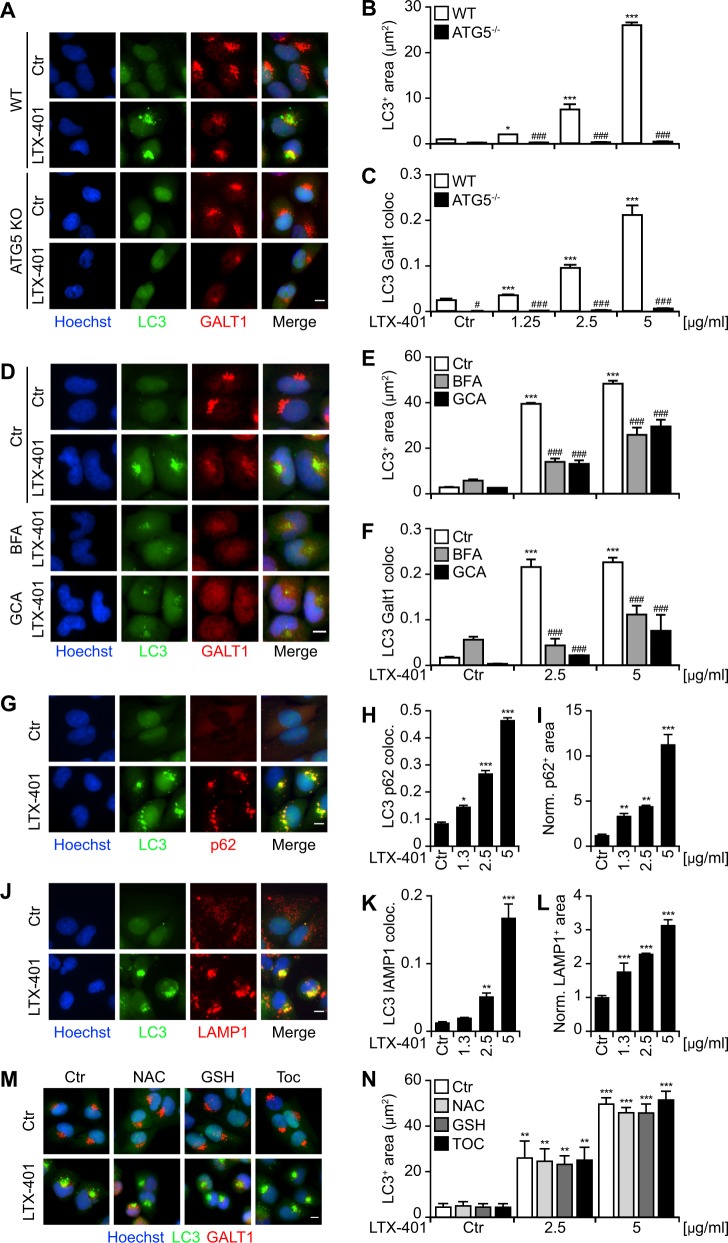
Fig. 6.
LTX-401, a Golgi apparatus (GA)-targeting oncolytic agent, induces the recruitment of the autophagic machinery to the GA. a–c Treatment with the oncolytic compound, LTX-401 induces LC3 aggregation (GFP-LC3+) at the site of the GA that requires ATG5. WT and ATG5−/− human osteosarcoma U2OS cells expressing GFP-LC3 cells were treated with LTX-401 at different concentrations, for 6 h, in complete medium. The presence of serum partially decreased the cytotoxicity of LTX-401, allowing the study of its effects at the cellular level. Representative images of GALT1 immunostaining are shown in a, whereas the average area of GFP-LC3+ puncta and the level of colocalization between GFP-LC3+ and GALT1+ structures are depicted in b, c. Data indicate means ± SD of triplicates of one representative experiment out of 2–4 repeats. (Two-way ANOVA, *p < 0.5, ***p < 0.001 versus untreated cells; #p < 0.05,###p < 0.001 versus ATG5 knockout). Size bar equals 10 µm. d–f The GA-disrupting agents golgicide A (GCA) and brefeldin A (BFA) inhibited the aggregation of LC3 induced by LTX-401. U2OS cells expressing GFP-LC3 were treated with LTX-401 in the presence of BFA (5 µg/mL) or in the presence of GCA (5 µM) for 6 h followed by GALT1 immunostaining. Representative images are depicted in d and quantitative analysis showing average area of GFP-LC3+ puncta or GALT1+ structures, as well as the level of colocalization between GFP-LC3+ and GALT1+ structures, are presented in e, f. Data are presented as means ± SD of triplicates of one representative experiment out of 2–4 repeats. (Two-way ANOVA, ***p < 0.001 versus untreated cells; ###p < 0.001 versus the presence of BFA or GCA). Size bar equals 10 µm. g–l LTX-401 induces GFP-LC3+ puncta, Golgi apparatus, p62, and lysosomes clustering. U2OS-GFP-LC3 cells were treated with LTX-401 for 6 h followed by immunostaining for p62 g or LAMP1 j proteins. Representative images are shown in g for p62 and in j for LAMP1. The quantitative analysis that reflects the colocalization of GFP-LC3+ puncta with p62+ or LAMP1+ structures are shown in h, k and the changes in the average area of p62+ or LAMP1+ structures after LTX-401 treatment are shown in i, l. Data are represented as means ± SD of triplicates of one representative experiment out of 2–4 repeats. (One-way ANOVA, *p < 0.5, **p < 0.01, ***p < 0.001 versus untreated cells). Size bar equals 10 µm. m, n Impact of different antioxidants on the LC3 aggregation mediated by LTX-401. U2OS cells expressing GFP-LC3 were incubated with the antioxidants n-acetyl-cysteine (NAC, 10 mM), glutathione (GSH, 5 mM), or tocopherol (TOC, 500 µM) for 3 h, followed by co-incubation with LTX-401 in the presence of the same antioxidants. Representative images are shown in m and the quantitative analysis that reflects the average area of GFP-LC3+ dots per cell are shown in n. Data are represented as means ± SD of triplicates of one representative experiment out of 2–4 repeats. (Two-way ANOVA, **p < 0.01, ***p < 0.001 versus ctr cells; ns versus the presence of antioxidants). Size bar equals 10 µm

