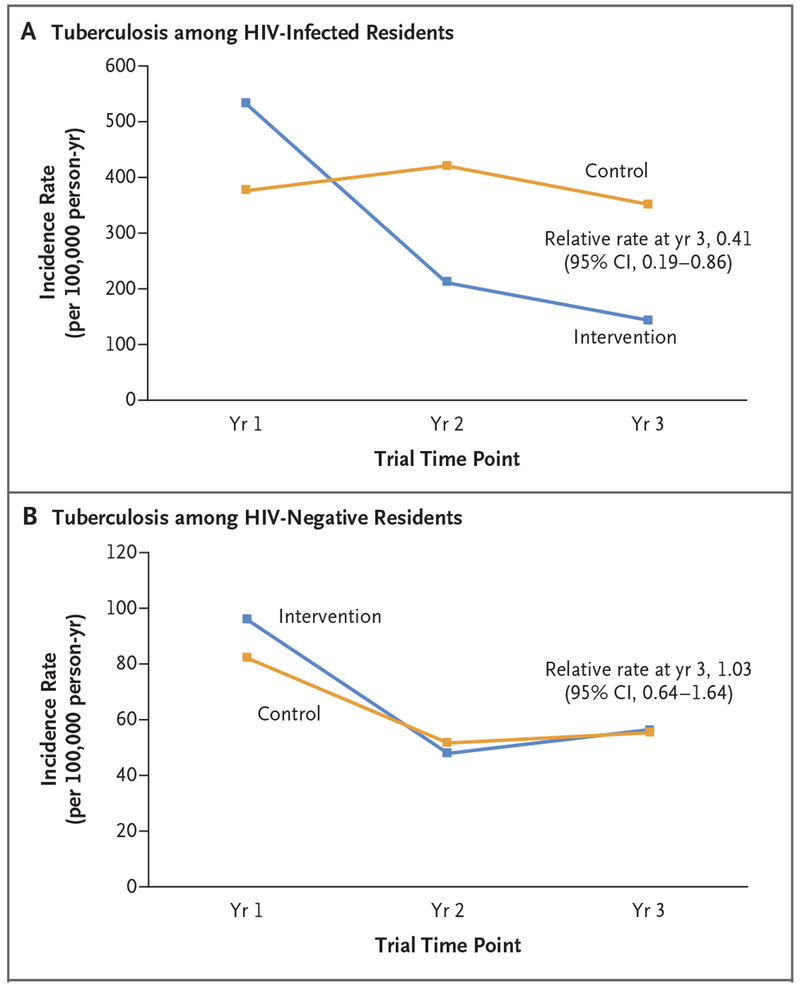
Figure 3. Incidence of Tuberculosis over Time.
Panel A shows the incidence rates of tuberculosis over time among residents who were HIV-positive at baseline and who had not received a diagnosis of active tuberculosis at baseline (13,430 residents). Panel B shows the incidence rates of tuberculosis over time among residents who were HIV-negative at baseline and who had not received a diagnosis of active tuberculosis at baseline (121,604 residents). For both analyses, data for person-time at risk were censored at the time of migration out of the community, death, or diagnosis of active tuberculosis, and the trial groups were compared at 3 years with the use of community-level targeted maximum likelihood estimation.

