
Figure 2.
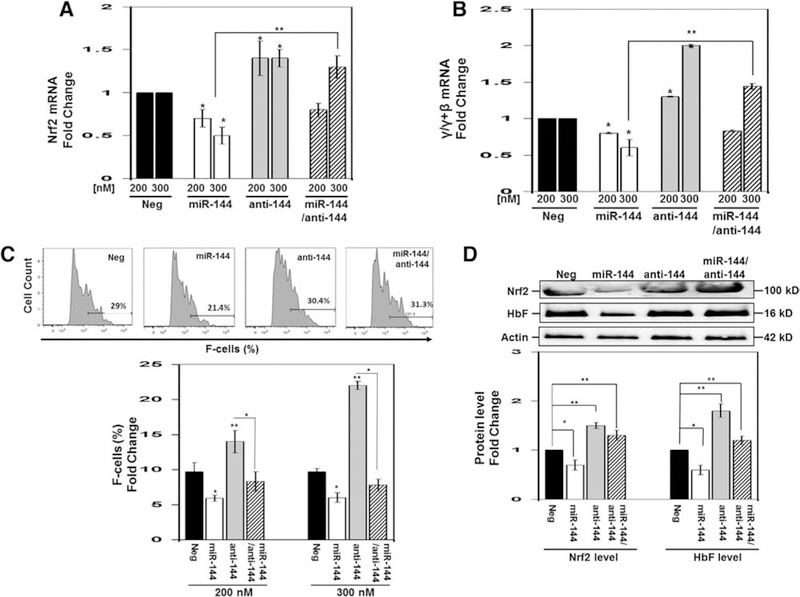
Overexpression of miR-144 repressed NRF2 and γ-globin gene expression in normal erythroid progenitors. Using CD34+ stem cells, adult erythroid progenitors were produced as described previously by our group [23,24] (see Methods for details). On day 8, we transfected cells with negative control, miR-144, and miR-144 antagomir (anit-144) mimics at 200 nmol/L and 300 nmol/L concentrations. In addition, combination treatments were conducted with 300 nmol/L each of miR-144 and antagomir. After 48 hours, cells were harvested for the different analyses. (A) RT-qPCR was performed to quantify NRF2 mRNA levels normalized to the internal control GAPDH. The negative mimic control (Neg) data were set to 1 to calculate the fold change in mRNA expression. Data are shown as the mean ± standard error of the mean with p < 0.05 considered statistically significant; *p < 0.05, **p < 0.01. (B) RT-qPCR was performed to quantify γ/γ+β-globin mRNA ratio calculated after the individual γ-globin and β-globin gene expression levels was normalized to the internal control GAPDH. See (A) for details of data analysis. (C) Representative histograms (top) of the flow cytometry analysis to determine the percentage of F-cells quantified in the graph using FACS Diva software. (D) Western blot analysis of NRF2 and HbF protein levels. Shown is a representative gel (top) where β-actin was the protein loading control. Densitometry analysis for the Western blot analysis was used to generate raw data shown in the graph for NRF2 and HbF.