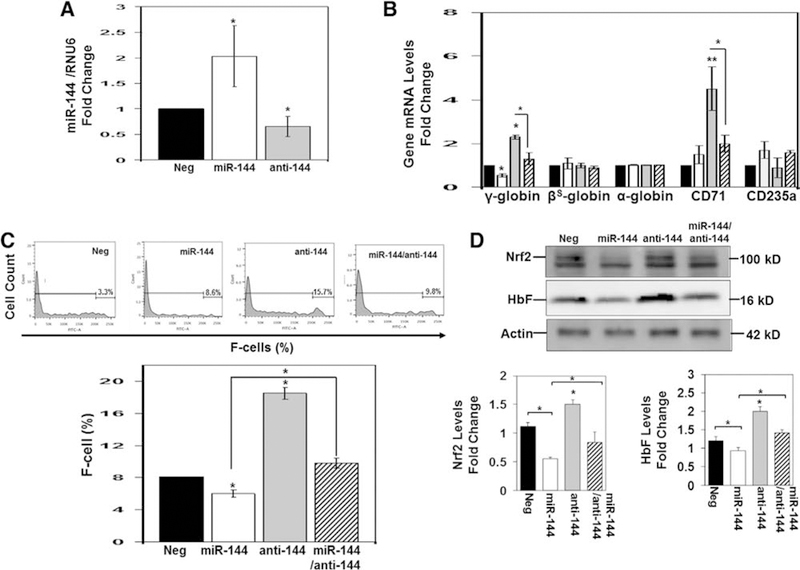
Figure 3.

Extended treatment with miR-144 produces a sustained increase in HbF expression in normal erythroid progenitors. Using CD34+ stem cells, erythroid progenitors were produced, followed by treatment for 5 days with negative control (Neg), miR-144, antagomir (anit-144), or combination treatments at a 300 nmol/L concentration. (A) Mature miR-144 levels were measured by RT-qPCR and normalized to RNU6 (internal control). The Neg control data (black bar) were set to 1 to calculate the fold change in miR-144 mimic (white bar) or miR-144 antagomir (gray bar) expression. Data are shown as the mean ± standard error of the mean with p < 0.05 considered statistically significant. (B) RT-qPCR was used to quantify the genes shown after normalization to the internal control GAPDH. Shown is combination treatment for miR-144 and antagomir (striped bar). (C) Representative histograms (top) generated by flow cytometry analysis to determine the percentage of F-cells quantified using FACS Diva software to generate the graph. (D) Representative Western blot gel where β-actin was the protein loading control (top). Densitometry analysis was used to generate raw data shown in the graphs (bottom).
