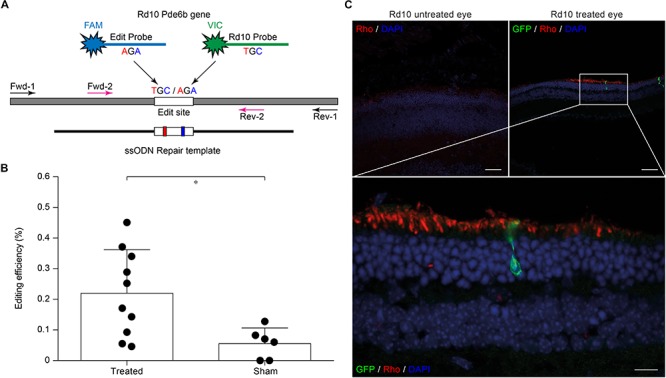
FIGURE 3.

Editing efficiency in vivo and rhodopsin staining in electroporated retinas. (A) Schematic representation of the ddPCR assay used to quantify in vivo editing efficiency. The Pde6b gene is in gray and the ssODN repair template in black (not in scale). The white rectangle represents the target editing region. Black and magenta arrows indicate primers pairs used for the nested-ddPCR. Red and blue letters indicate base mismatches detected by the two specific fluorescent probes for the edited and unedited alleles (blue and green, respectively). (B) Quantification of the mean (±SD) percentage of editing in Rd10 treated retinas. (C) Retinal section from Rd10 mice electroporated at P3, collected at P30, and stained for rhodopsin (Rho, red), GFP (green), and DAPI (blue). Scale bars: top left and top right 25 μm; bottom 10 μm.
