FIGURE 4.
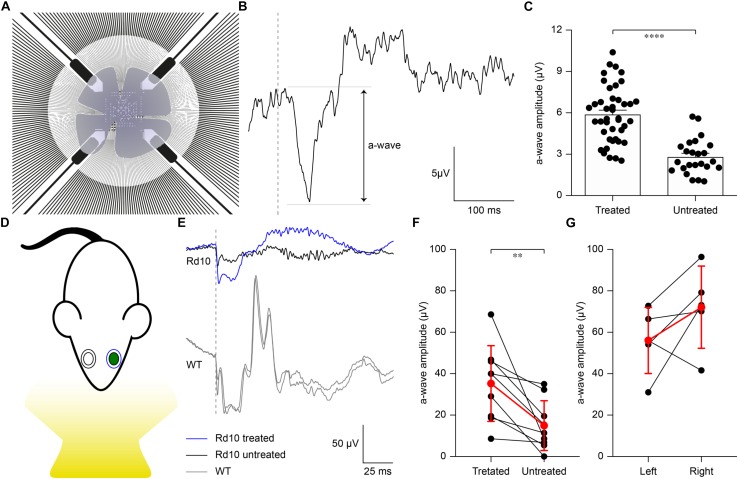
Preservation of ex vivo microelectroretinograms at P60 and in vivo electroretinograms at P30. (A) Schematic representation of the ex vivo experiment. The retina was dissected and placed on a transparent MEA with the retinal ganglion cell side down in contact with the electrodes. The retina was stimulated using green light pulses coming from the bottom. (B) Representative recording from a Rd10 retina treated at P3. (C) Quantification of the mean (±SEM) amplitude of the a-wave in the two experimental groups: Rd10 treated (5.89 ± 0.31, n = 42 channels from 2 retinas) and Rd10 untreated (2.81 ± 0.26, n = 27 channels from 2 retinas) retinas. (D) Sketch of the recording setup in which the electrode recording from the treated eye (green) is in blue, while the one recording from the untreated eye is in black. (E) Representative ERG responses for the treated (blue) and untreated (black) eyes of a Rd10 mouse treated at P3 (top traces) and for the right and left eyes (both in gray) of a WT mouse (bottom panel). The gray dashed lines represent the occurrence of the flash. (F) Comparison of the a-wave amplitude of the treated and untreated eyes in Rd10 mice. Mean (±SD, n = 9) in red. (G) Comparison of the a-wave amplitude of the left and right eyes in WT mice. Mean (±SD, n = 5) in red.

