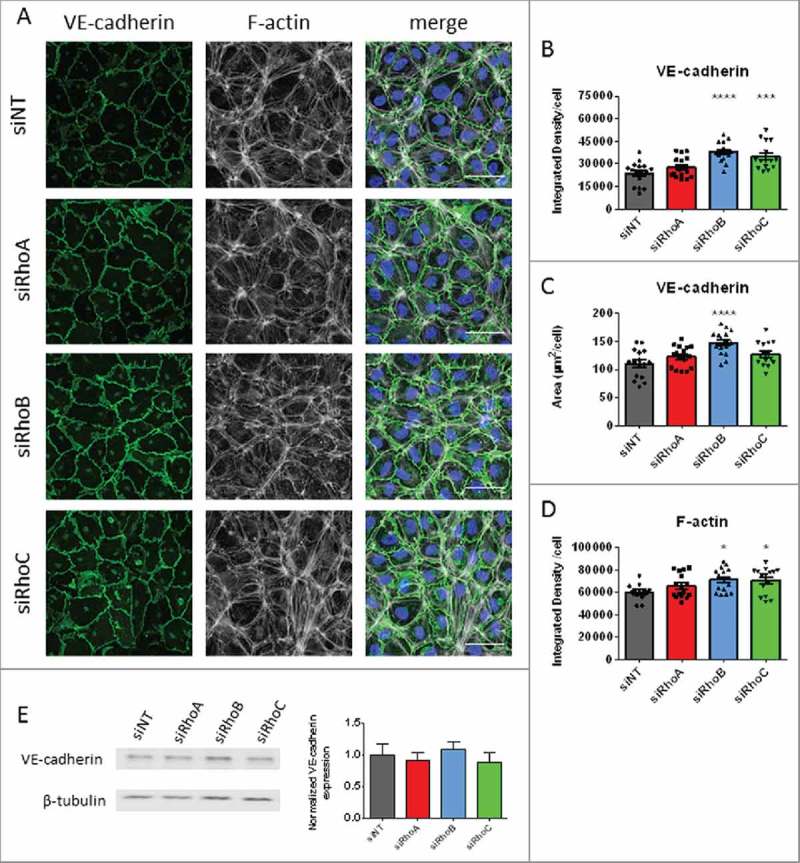
Figure 3.

The effects of single knockdowns of RhoA RhoB and RhoC on basal endothelial morphology. (A) Immunofluorescent staining of VE-cadherin (green), F-actin (white) and nuclei (blue) in HUVECs for visualization of adherens junctions following loss of RhoA, RhoB and RhoC. Scale bars represent 50 μM. Representative pictures of 3-4 experiments. (B) VE-cadherin Integrated Density/cell; each point representing an individual measurement. (C) VE-cadherin area per cell. (D) F-actin Integrated Density per cell. (E) Western blot analysis for VE-cadherin of whole cell lysates collected from HUVECs 72 hours after transfection with siNT, siRhoA, siRhoB or siRhoC. Representative blots of 3 experiments are shown. Tubulin is included as loading control. Bar graphs represent mean ± SEM from 3 individual experiments all normalized to siNT. Data in panel B,C and D represent mean ± SEM (bar graphs) of 12–16 values from 4 independent experiments. *p < 0.05, ***p < 0.001, ****p < 0.0001 in Dunnett's post-hoc analysis of one-way ANOVA.
