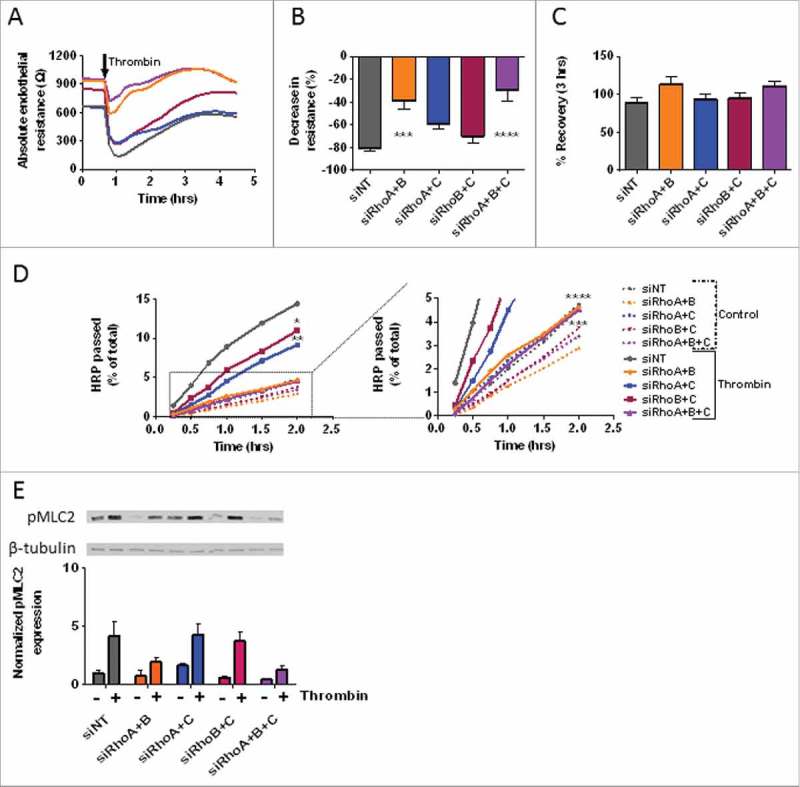
Figure 6.

The effect of thrombin on monolayers following combined loss of RhoA, RhoB and RhoC. (A) Thrombin-induced endothelial barrier disruption in cells transfected with double and triple knockdowns of RhoA, RhoB and RhoC siRNAs. Arrow indicated addition of 1 U/mL thrombin. (B) The thrombin response (% decrease in resistance) in control vs. RhoA, RhoB and RhoC double and triple knockdown HUVECs. Values represent the % reduction in resistance at the lowest point after addition of thrombin. (C) The % recovery 3-hours after thrombin relative to the start values of control vs. RhoA, RhoB and RhoC double and triple knockdown HUVECs. (D) Time-dependent effects of RhoA, RhoB and RhoC double and triple knockdowns on the passage of HRP across control and thrombin-stimulated HUVECs. The graph on the right is a magnified portion of the left graph, as indicated by the dashed box and lines. (E) Western blot analysis of whole cell lysates showing the effect of thrombin stimulation in RhoA, RhoB and RhoC double and triple knockdown HUVECs on the phosphorylation of MLC. Representative blots from 3 experiments are shown. Tubulin is included as loading control. Bar graph represents mean ± SEM from 3 individual experiments all normalized to siNT without thrombin. Panel A, B, and C represent average values (line graph) or mean ± SEM (bar graph) of 5 experiments performed in duplicate or triplicate. *p < 0.05, **p < 0.01, ***p < 0.001, ****p < 0.0001 in Dunnett's post-hoc analysis of one-way ANOVA. Panel D represent average values of 3–5 experiments performed in triplicates. *p < 0.05, **p < 0.01, ***p < 0.001, ****p < 0.0001 in Dunnett's post-hoc analysis of repeated measures ANOVA.
