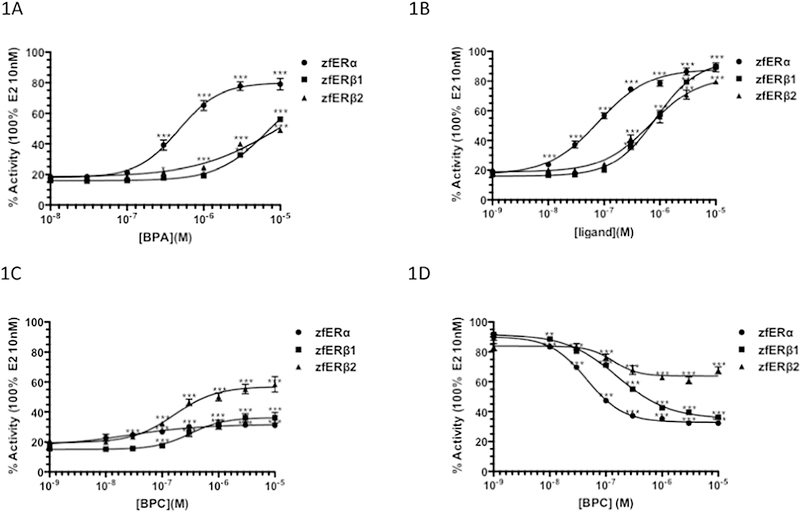
Fig. 1.
Agonistic and antagonistic activity of bisphenols in HELN zfER reporter cell lines. (A-C) Dose-response curves for BPA, BPAF, and BPC in HELN zfER reporter cell lines. Cells were incubated for16h with various concentrations of BPA, BPAF, and BPC. (D) Dose responsive curves of BPC in HELN zfER reporter cell lines. Cells were incubated for 16h with various concentrations of BPC in presence of in presence of 1 nM E2. Data were expressed as percentage of the maximal activity induced by E2 10 nM. EC50 values were measured using GraphPad Prism (GraphPad Software Inc). Datas were analyzed for significant differences using one-way ANOVA followed by Dunnet’s post-comparison test (vs.control) (***p<0.001, **p<0.01, *p<0.05).

