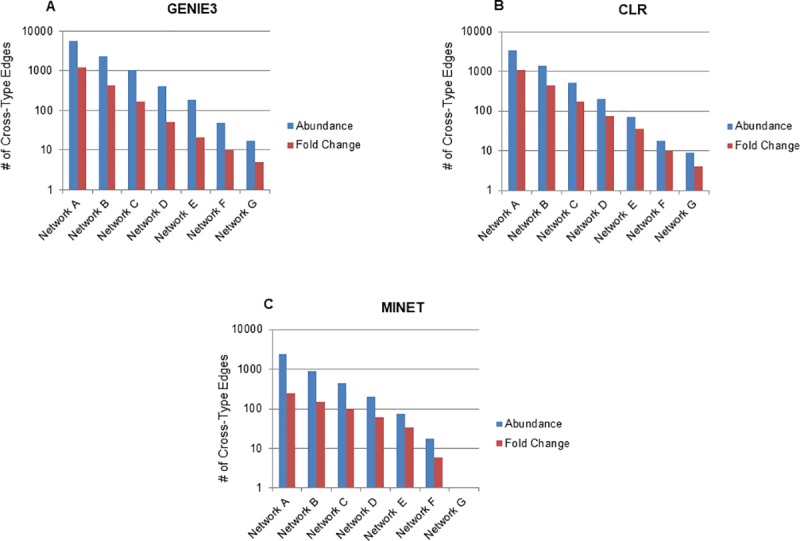
Fig 7. Effects of using fold change values on cross-type edges.

(A) Using a smaller dataset of abundance values for proteins and transcripts, networks were inferred using GENIE3 and cross-type edges determined for each network (blue bars). Similar networks were also inferred for fold change values using this same dataset (red bars). (B) The same analysis using CLR instead of GENIE3. (C) The same analysis using MINET instead of GENIE3.
