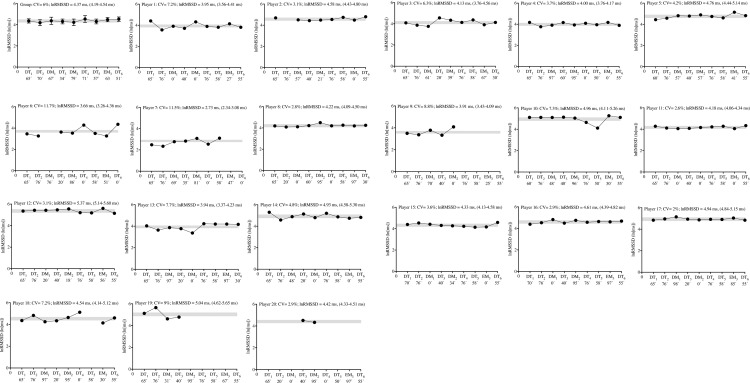
Fig 3. Group and individual subject (n = 20) cardiac parasympathetic activity displayed during 9 days of an international tournament.
Group and individual black dots represent daily changes in natural logarithm of the root mean square of successive RR intervals (lnRMSSD). lnRMSSD averages (with max-min values) are also presented. The grey area represents the smallest worthwhile change zone (3%) [36]. The exposure time (min) for each day is also presented on all days of the tournament (x axis). Abbreviations: DT, day-training; DM, day-match; EM, evening-match; CV, coefficient of variation.

