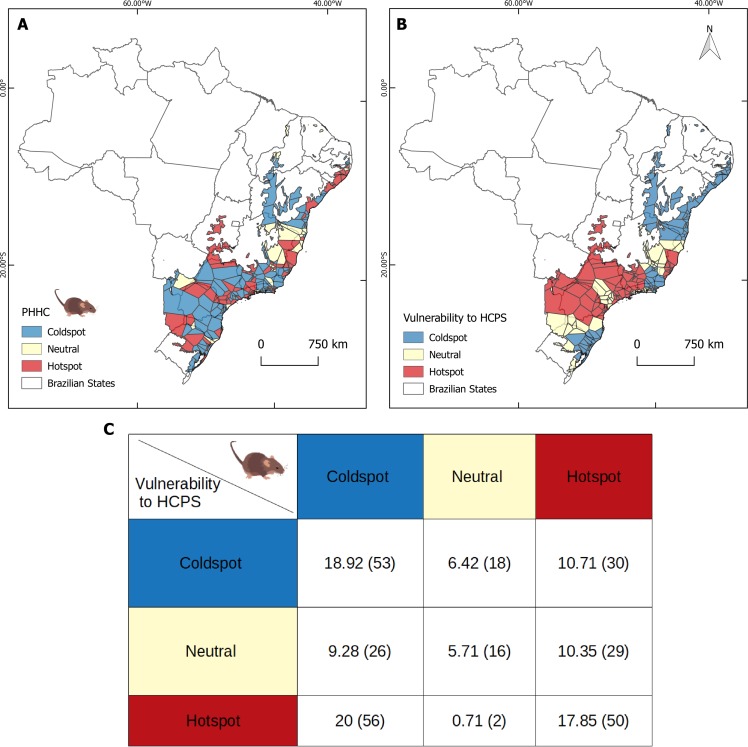
Fig 3. Hotspot maps.
A. Predicted pathogenic genotype hantavirus host proportions in the community (PHHC). B. Human vulnerability to hantavirus disease (HCPS) of municipalities within the Atlantic Forest. For comparison we used Voronoi polygon optimization based on coordinates of 280 sampling sites. C. Spatial matching (%) of hotspots and coldspots of both variables. Number of Voronoi polygons in each class is in parentheses.

