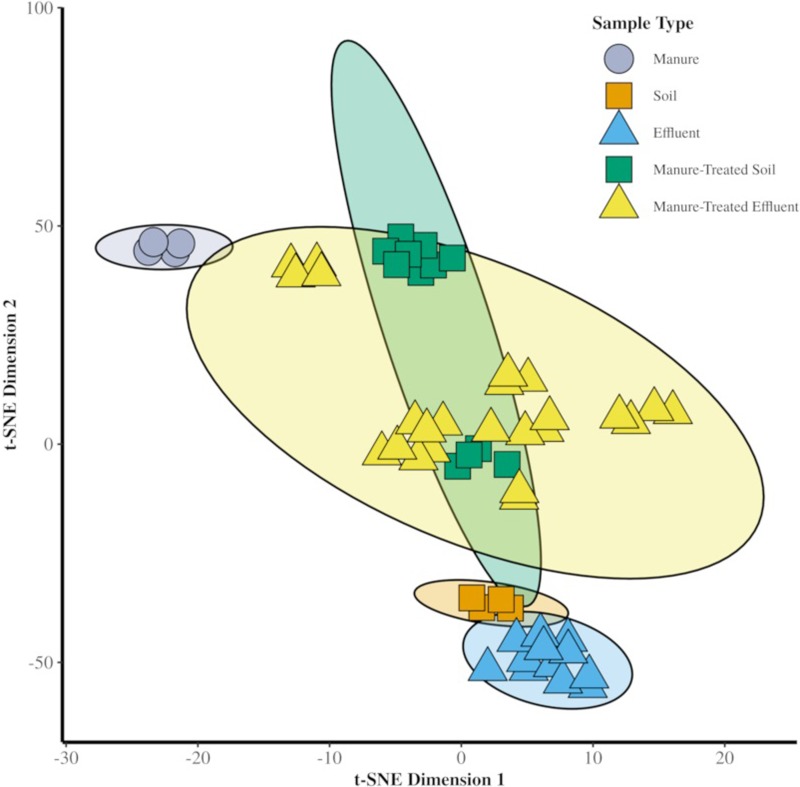
Fig 2. t-SNE dimension reduction using the Bray-Curtis distance of the 56 samples, based on read-sequence relative abundance.
Different shapes represent different sample sources (e.g., both control soil and manure-treated soil samples are squares). The ellipse represents 95% confidence intervals of the variance for each sample type.

